SanDisk Professional G-DRIVE SSD and ArmorLock SSD Review
by Ganesh T S on October 12, 2021 8:00 AM ESTPCMark 10 Storage Bench - Real-World Access Traces
There are a number of storage benchmarks that can subject a device to artificial access traces by varying the mix of reads and writes, the access block sizes, and the queue depth / number of outstanding data requests. We saw results from two popular ones - ATTO, and CrystalDiskMark - in a previous section. More serious benchmarks, however, actually replicate access traces from real-world workloads to determine the suitability of a particular device for a particular workload. Real-world access traces may be used for simulating the behavior of computing activities that are limited by storage performance. Examples include booting an operating system or loading a particular game from the disk.
PCMark 10's storage bench (introduced in v2.1.2153) includes four storage benchmarks that use relevant real-world traces from popular applications and common tasks to fully test the performance of the latest modern drives:
- The Full System Drive Benchmark uses a wide-ranging set of real-world traces from popular applications and common tasks to fully test the performance of the fastest modern drives. It involves a total of 204 GB of write traffic.
- The Quick System Drive Benchmark is a shorter test with a smaller set of less demanding real-world traces. It subjects the device to 23 GB of writes.
- The Data Drive Benchmark is designed to test drives that are used for storing files rather than applications. These typically include NAS drives, USB sticks, memory cards, and other external storage devices. The device is subjected to 15 GB of writes.
- The Drive Performance Consistency Test is a long-running and extremely demanding test with a heavy, continuous load for expert users. In-depth reporting shows how the performance of the drive varies under different conditions. This writes more than 23 TB of data to the drive.
Despite the data drive benchmark appearing most suitable for testing direct-attached storage, we opt to run the full system drive benchmark as part of our evaluation flow. Many of us use portable flash drives as boot drives and storage for Steam games. These types of use-cases are addressed only in the full system drive benchmark.
The Full System Drive Benchmark comprises of 23 different traces. For the purpose of presenting results, we classify them under five different categories:
- Boot: Replay of storage access trace recorded while booting Windows 10
- Creative: Replay of storage access traces recorded during the start up and usage of Adobe applications such as Acrobat, After Effects, Illustrator, Premiere Pro, Lightroom, and Photoshop.
- Office: Replay of storage access traces recorded during the usage of Microsoft Office applications such as Excel and Powerpoint.
- Gaming: Replay of storage access traces recorded during the start up of games such as Battlefield V, Call of Duty Black Ops 4, and Overwatch.
- File Transfers: Replay of storage access traces (Write-Only, Read-Write, and Read-Only) recorded during the transfer of data such as ISOs and photographs.
PCMark 10 also generates an overall score, bandwidth, and average latency number for quick comparison of different drives. The sub-sections in the rest of the page reference the access traces specified in the PCMark 10 Technical Guide.
Booting Windows 10
The read-write bandwidth recorded for each drive in the boo access trace is presented below.
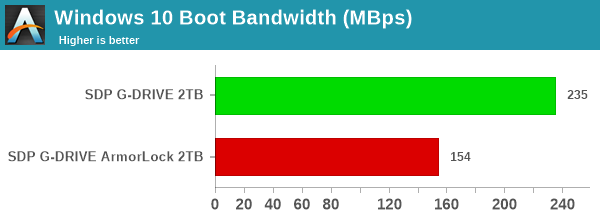
The boot workload sets the tone for all the benchmarks to follow, with the G-DRIVE SSD enjoying a lead of more than 50% over the ArmorLock.
Creative Workloads
The read-write bandwidth recorded for each drive in the sacr, saft, sill, spre, slig, sps, aft, exc, ill, ind, psh, and psl access traces are presented below.
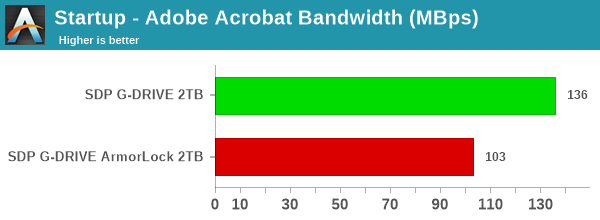
Similar to the boot workload, all the creative workloads show a 20 - 75% advantage for the G-DRIVE SSD over the ArmorLock SSD.
Office Workloads
The read-write bandwidth recorded for each drive in the exc and pow access traces are presented below.
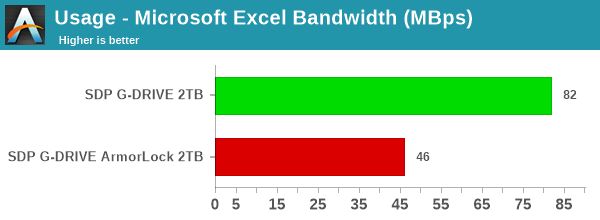
The G-DRIVE SSD is around 75% faster than the ArmorLock SSD for editing spreadsheets and presentations directly off the drive.
Gaming Workloads
The read-write bandwidth recorded for each drive in the bf, cod, and ow access traces are presented below.
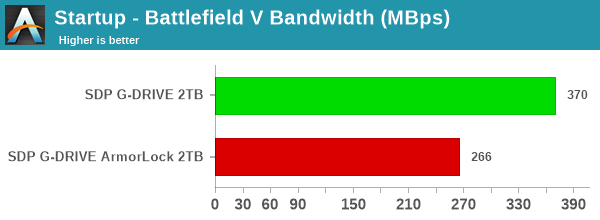
The G-DRIVE is anywhere between 20 - 50% faster than the ArmorLock SSD from the viewepoint of loading games.
Files Transfer Workloads
The read-write bandwidth recorded for each drive in the cp1, cp2, cp3, cps1, cps2, and cps3 access traces are presented below.
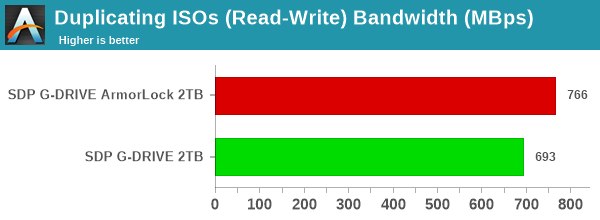
The file transfer workloads finally see the ArmorLock SSD performing slightly better - even managing a 10% lead for workloads involving large files. That said, some workloads involving large number of small files (such as exporting or duplicating photos) see the G-DRIVE SSD performing 40 - 75% better.
Overall Scores
PCMark 10 reports an overall score based on the observed bandwidth and access times for the full workload set. The score, bandwidth, and average access latency for each of the drives are presented below.

The PCMark 10 Storage Bench sees the ArmorLock SSD performing dismally, contrary to expectations. The G-DRIVE SSD lands a score of 1222 compared to the ArmorLock's 852.
Once the ArmorLock NVMe SSD is subject to PCMark's initialization routine and/or subject to workloads that are not purely sequential in nature, a limiting factor seems to kick in and drastically reduce the performance of the drive. Since the drive is a closed system, we were unable to determine whethere the blame lay with the always-on encryption aspect, or it had something to do with the firmware on the SSD.


6 Comments
View All Comments
Sivar - Tuesday, October 12, 2021 - link
I have had a good experience with the 500GB model for Tesla Sentry Mode. It "just works", though is probably overkill.Foeketijn - Wednesday, October 13, 2021 - link
I just want to say, I really appreciate the indepth reviews on this site,Just the pop-out videos are making me avoid Anandtech.
It's not even in my chrome preferred websites homepage I noticed.
It's been my almost daily visit for more than 10 years now.
TheinsanegamerN - Wednesday, October 13, 2021 - link
Imagine not using an adblocker in 2021.logoffon - Friday, October 15, 2021 - link
Imagine telling people to install an extension that will eats RAM as much as the browser itself in 2021.Ryan Smith - Wednesday, October 13, 2021 - link
I hear you on the videos.I wish I could give you a more useful answer, but the long and the short of it is that our publisher is happy with them. (So long as they're behaving correctly, at any rate)
Sivar - Friday, October 22, 2021 - link
I have periodically disabled ad blocking on Anandtech to better support a site I believe in.3 seconds later: NOPE.
It's just too in-your-face and distracting. I cannot read while lights are flashing and trucks are driving on the side panel. Text ads FTW.