Crucial Portable SSD X6 and X8 2TB Review: QLC for Storage On-the-Go
by Ganesh T S on October 21, 2020 8:00 AM ESTPCMark 10 Storage Bench - Real-World Access Traces
There are a number of storage benchmarks that can subject a device to artificial access traces by varying the mix of reads and writes, the access block sizes, and the queue depth / number of outstanding data requests. We saw results from two popular ones - ATTO, and CrystalDiskMark - in a previous section. More serious benchmarks, however, actually replicate access traces from real-world workloads to determine the suitability of a particular device for a particular workload. Real-world access traces may be used for simulating the behavior of computing activities that are limited by storage performance. Examples include booting an operating system or loading a particular game from the disk.
PCMark 10's storage bench (introduced in v2.1.2153) includes four storage benchmarks that use relevant real-world traces from popular applications and common tasks to fully test the performance of the latest modern drives:
- The Full System Drive Benchmark uses a wide-ranging set of real-world traces from popular applications and common tasks to fully test the performance of the fastest modern drives. It involves a total of 204 GB of write traffic.
- The Quick System Drive Benchmark is a shorter test with a smaller set of less demanding real-world traces. It subjects the device to 23 GB of writes.
- The Data Drive Benchmark is designed to test drives that are used for storing files rather than applications. These typically include NAS drives, USB sticks, memory cards, and other external storage devices. The device is subjected to 15 GB of writes.
- The Drive Performance Consistency Test is a long-running and extremely demanding test with a heavy, continuous load for expert users. In-depth reporting shows how the performance of the drive varies under different conditions. This writes more than 23 TB of data to the drive.
Despite the data drive benchmark appearing most suitable for testing direct-attached storage, we opted to run the full system drive benchmark as part of our evaluation flow. Many of us use portable flash drives as boot drives and storage for Steam games. These types of use-cases are addressed only in the full system drive benchmark.
The Full System Drive Benchmark comprises of 23 different traces. For the purpose of presenting results, we classify them under five different categories:
- Boot: Replay of storage access trace recorded while booting Windows 10
- Creative: Replay of storage access traces recorded during the start up and usage of Adobe applications such as Acrobat, After Effects, Illustrator, Premiere Pro, Lightroom, and Photoshop.
- Office: Replay of storage access traces recorded during the usage of Microsoft Office applications such as Excel and Powerpoint.
- Gaming: Replay of storage access traces recorded during the start up of games such as Battlefield V, Call of Duty Black Ops 4, and Overwatch.
- File Transfers: Replay of storage access traces (Write-Only, Read-Write, and Read-Only) recorded during the transfer of data such as ISOs and photographs.
PCMark 10 also generates an overall score, bandwidth, and average latency number for quick comparison of different drives. The sub-sections in the rest of the page refrence the access traces specified in the PCMark 10 Technical Guide.
Booting Windows 10
The read-write bandwidth recorded for each drive in the boo access trace is presented below.
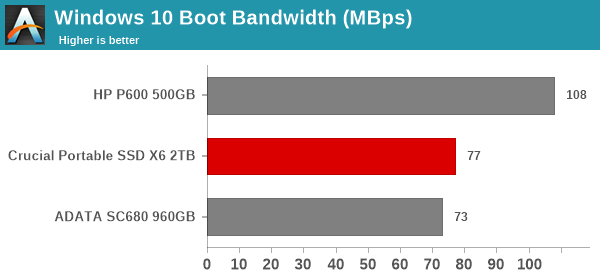
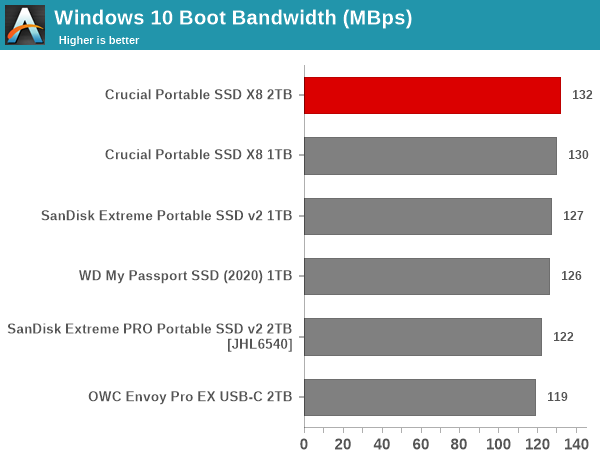
The read-intensive workloads optimization on the X8 helps it to climb to the top of the charts in the tightly clustered NVMe-class graph. On the other hand, the X6 is well below the HP P600 for this workload, but with a narrow lead over the ADATA SC680.
Creative Workloads
The read-write bandwidth recorded for each drive in the sacr, saft, sill, spre, slig, sps, aft, exc, ill, ind, psh, and psl access traces are presented below.
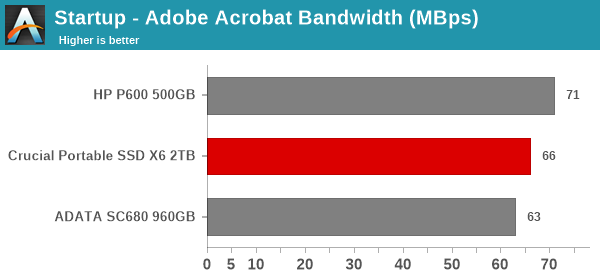
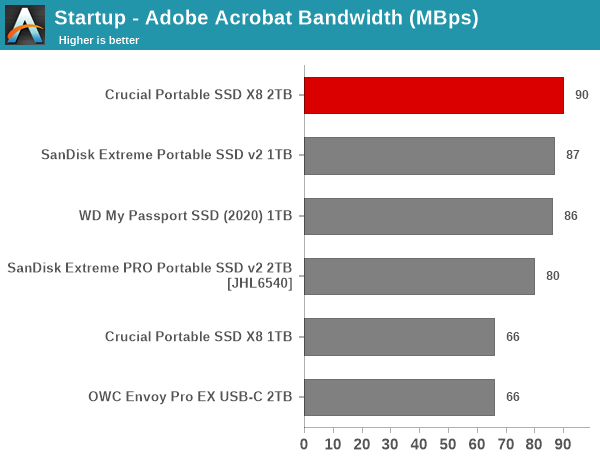
The X6 slots below the HP P600 in the performance charts for creative workloads, but is neck-to-neck with the ADATA SC680. The advantage of the X6 lies in its capacity point - 2TB vs. the 500GB / 1TB of the others in the SATA-class set. The X8, on the other hand, leads the charts for almost all creative workloads. The large amount of SLC cache does help in these types of scenarios, as we shall see in the next section.
Office Workloads
The read-write bandwidth recorded for each drive in the exc and pow access traces are presented below.
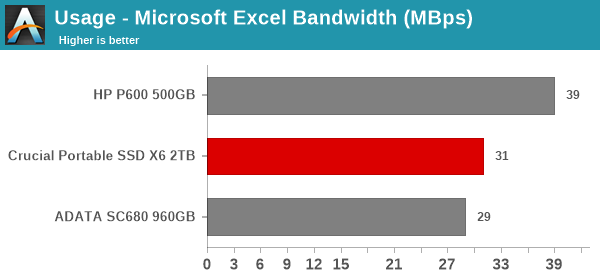
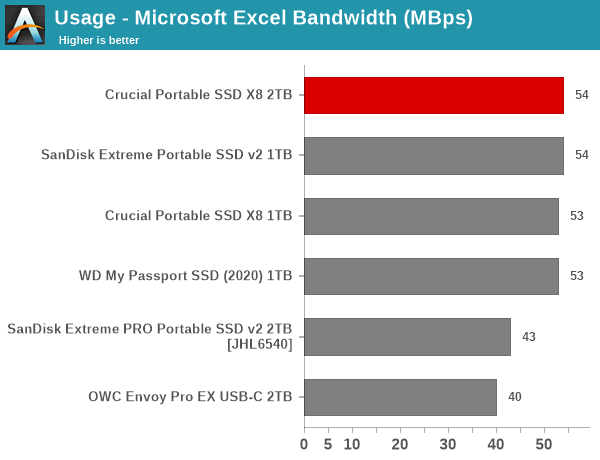
The SATA-class drives follow the same ordering as seen in the creative workloads section. The X8 ties with a bunch of other SSDs in delivering very similar performance numbers for the office workloads.
Gaming Workloads
The read-write bandwidth recorded for each drive in the bf, cod, and ow access traces are presented below.
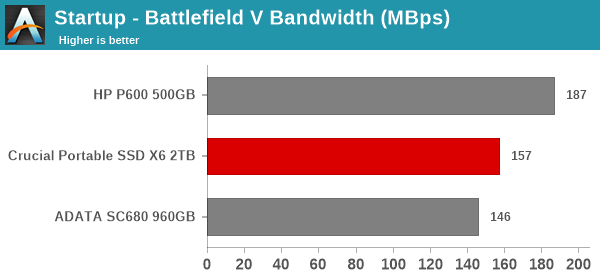
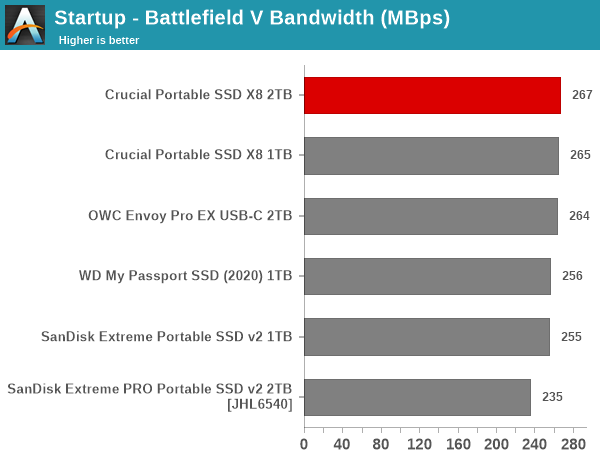
The X6 slots in the middle of the pack, while the X8 leads in the gaming workloads. This augurs well for using the X8 as a portable Steam drive, and for usage with consoles.
Files Transfer Workloads
The read-write bandwidth recorded for each drive in the cp1, cp2, cp3, cps1, cps2, and cps3 access traces are presented below.
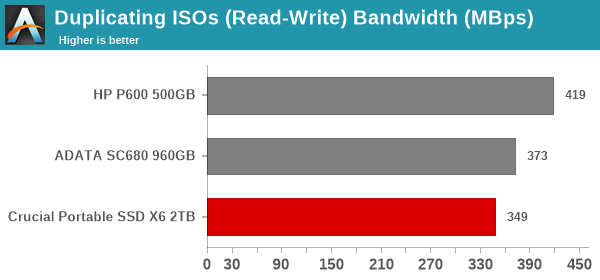
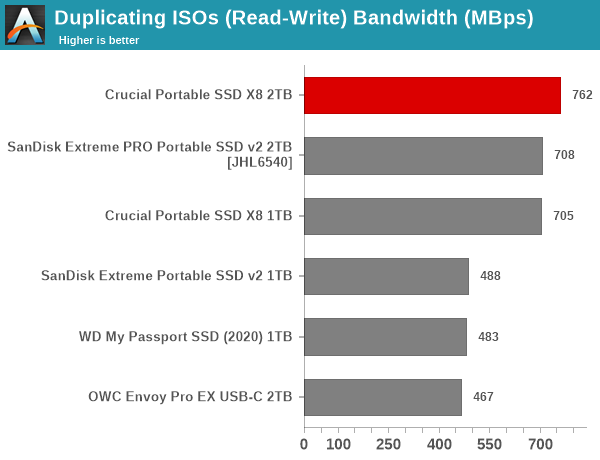
The X6 surprisingly does well in the file transfer workload, though the write-only traces are a problem again. The X8 also acquits itself well, with only the write-only components pushing it to the middle of the pack.
Overall Scores
PCMark 10 reports an overall score based on the observed bandwidth and access times for the full workload set. The score, bandwidth, and average access latency for each of the drives are presented below.
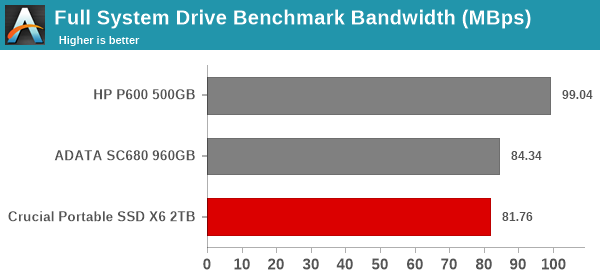
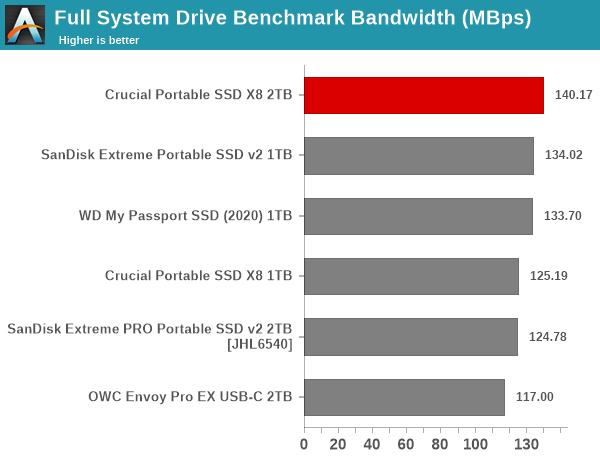
The X6 and X8 are at contrasting places in their respective sets in the overall scores. While the X8 leads by a comfortable margin, the X6 is well below the HP P600. Overall, we see the X8 2TB version being a very competitive performer for traditional consumer workloads. Despite being a QLC drive, how does the X8 manage this feat? We take a look at that in the final section.


22 Comments
View All Comments
mostlyfishy - Wednesday, October 21, 2020 - link
UASP and TRIM support mean these look good for a boot device on the Raspberry Pi 4s!Meteor2 - Monday, October 26, 2020 - link
Why would you pair a $35 SBC with a $300 SSD?MartenKL - Wednesday, October 21, 2020 - link
No Samsung T7 or X5 in the comparison?ganeshts - Wednesday, October 21, 2020 - link
X5 is a Thunderbolt 3 SSD - so I don't consider it here in the USB 3.2 Gen 2 category.For T7, we only reviewed the 1TB capacity, so the only non-2TB ones are either the same X8 family or the SSDs launched within the last two months. FWIW, T7 didn't impress us too much: https://www.anandtech.com/show/16120/sandisk-extre...
Duncan Macdonald - Wednesday, October 21, 2020 - link
What is the rated write endurance ? External SSDs are often used to transfer large amounts of data between machines - in this use case the TBW rating is important.wrkingclass_hero - Wednesday, October 21, 2020 - link
Probably the most important spec... if it can only be filled 600 times that's a serious issue.RSAUser - Thursday, October 22, 2020 - link
If it's not the main OS drive, it will probably last a lot longer, most SSD wear is the small temp files of the OS rather than file transfers.Most drives are rated at hundreds of TB, standards are something like 100TB for every 250GB, and I doubt anyone would hit 4000 cycles within a few years, and by that point it should play nicely and be read only.
What I am more worried about is how long it can store data without being powered up, I have a couple of external HDD's that I haven't plugged in in years.
Meteor2 - Monday, October 26, 2020 - link
I too would like to know how stable SSDs are unpowered long-term.TheinsanegamerN - Monday, October 26, 2020 - link
SSD and long term don’t belong in the same sentence. Guaranteed data integrity for NAND flash memory is measured in weeks. Hard drives are measured in months, but can typically go years.Our treasury found this out the hard way when the handful of laptops they bought with SSDs in them all failed to boot after sitting for 2 months. SSDs were fine, but the data integrity was not.
If you want long term cold storage and tape is not an option stick with writable blu rays or external HDDs and plug them in once every few months
MrCommunistGen - Thursday, October 22, 2020 - link
For what it is worth, CrystalDiskInfo has had a bunch of updates since v8.3.2. There's a chance that the latest version (currently v8.8.9) might detect TRIM support on the X8.