The AMD Ryzen 9 3950X Review: 16 Cores on 7nm with PCIe 4.0
by Dr. Ian Cutress on November 14, 2019 9:00 AM ESTConclusion
There are many attributes by which a processor is examined. Absolute performance is the one that grabs the headlines – either by way of single core performance, or the chip performance as a whole, most often applied to an arbitrary benchmark. Aside from raw by-the-numbers performance, we also look at popular workloads, where the CPU plays a critical role. Gaming, on the other hand, is where the CPU is still important but often secondary, and so we end up analyzing the relationship between the CPU and the GPU. Beyond performance, we have cost to consider, and if a product is priced appropriately for the market it aims for.
For performance, perhaps the obvious that was expected was observed: AMD’s 3950X knocks down walls that only a couple of years ago seemed impenetrable. When compared to its immediate rivals, The Ryzen 9 3950X smashes through several of our tests published here, such as the Photoscan, Blender, Handbrake, and 7-zip, while CineBench R20 and SPEC in our benchmark database also have some strong numbers.
Because it is competing against Intel’s high-end Skylake Refresh desktop platform (comparing equal core count, rather than price), it can’t compete when AVX-512 is in play, or memory bandwidth is the limiting factor. At some level having this many cores requires extra memory bandwidth, and dual channel isn’t going to cut it. This is one of the downsides of moving ‘mainstream’ up to a HEDT price point, even if it does come with more cores.
There are some other minor points to note – if we compare single threaded performance, despite AMD’s Zen 2 having a general IPC advantage, the Core i9-9900KS is still running at 5.0 GHz for sustained single threaded work, which is still 7-15% higher than the Ryzen 3950X, and as a result it does pull out ahead in a number of ST tests as well as in low resolution (CPU-bound) gaming. At higher resolution gaming, most of the CPUs in our test perform within a fraction of each other.
We did test the Ryzen 9 3950X with both the normal Windows 'High Performance' (HP) power plan, and the 'Ryzen High Performance' (RHP) power plan that comes with the chipset drivers. Overall the RHP showed higher frequencies and 2-3% more performance than the HP, for about +4W on peak power consumption. Now we're in a quandry as to continue with the RHP - it's technically not out of the box performance, however we still have to install chipset drivers with every test, and the RHP is part of the package. We recommend users use the RHP either way, however it would be helpful if Microsoft recognized a Ryzen 3000 series processor and automatically offered / enabled the RHP in the power settings.
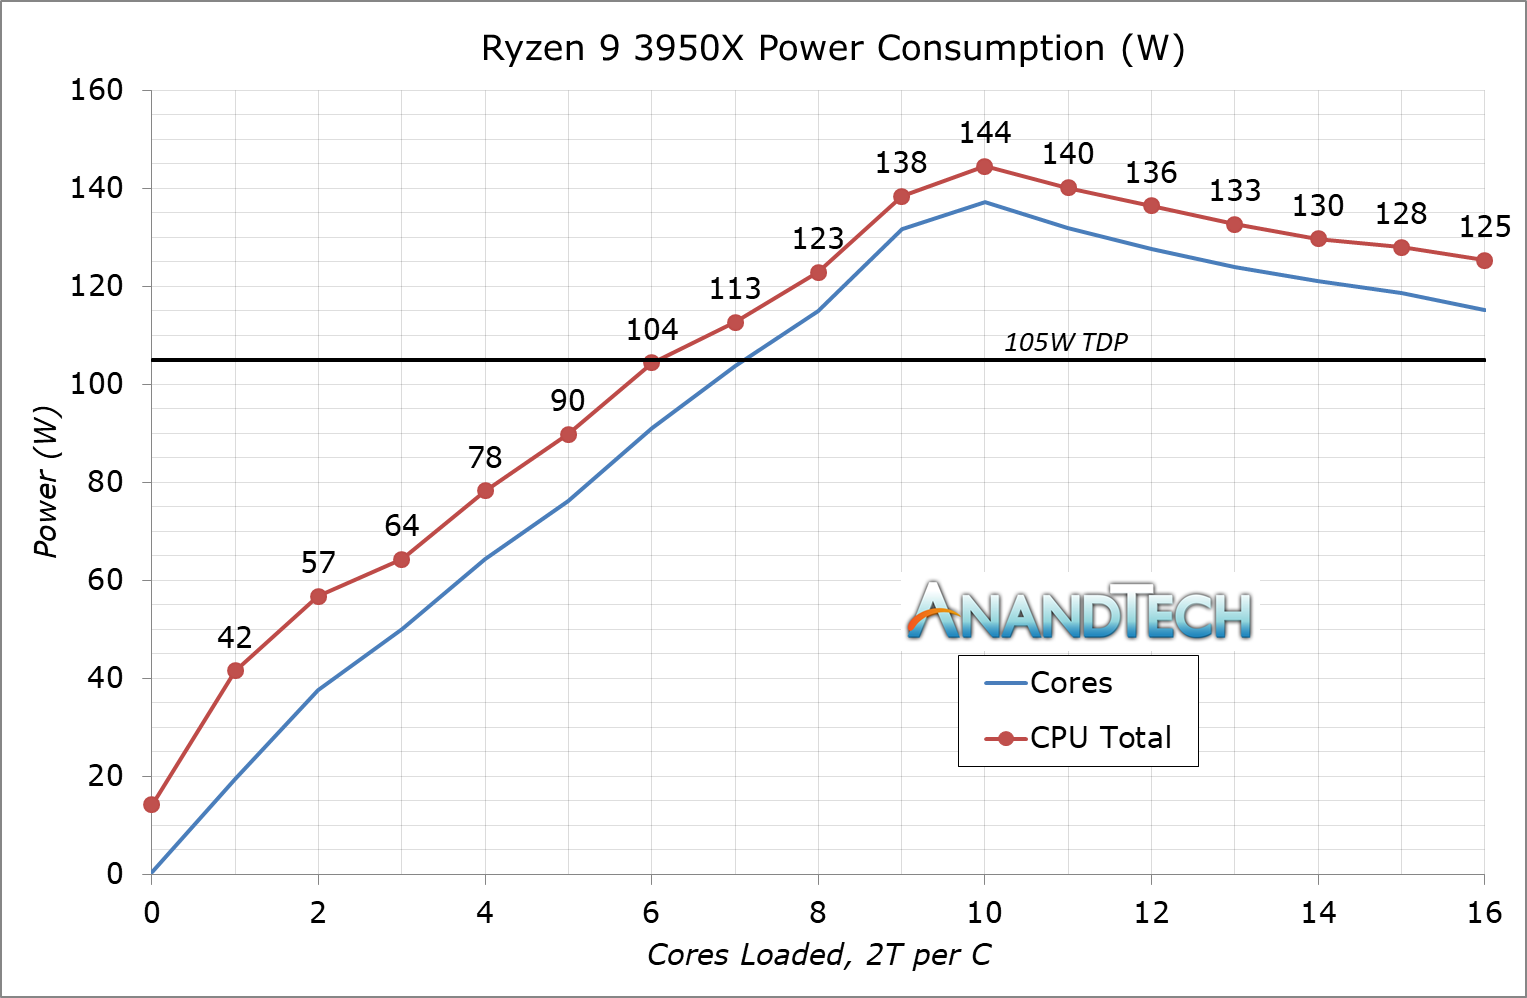
Another key point in our testing was power. Using our power consumption test that outputs the processor's internal power metrics, we saw a considerable inflection in overall CPU power consumption when more than 10 cores were loaded. At this level, the two chiplets are over half occupied, so the desire to balance power over cores and reduce frequency occurs. Normally we expect the power to equalize at that peak level across all the cores, however something else is happening on the chip that means a lower overall power level is found. This is perhaps current density on the Zen 2 cores and chiplets becoming a factor, although we are talking about moving from 10W per core to 12W per core, which isn't a considerable jump, but might just be enough of a voltage jump to become a concern at some level. We technically saw this on the Ryzen 9 3900X as well, with the 10-core power consumption being a few watts higher than the 12-core result. But as that chip only has 12 cores, it wasn't much of a concern.
The Ryzen 3000 family also marks a turning point regarding AMD's use of official TDP ratings. We're seeing power consumption values higher than the TDP on the box, equal to AMD's PPT rating. Before with Ryzen 1000 and Ryzen 2000 there was some good parity between TDP and power consumption, but now there is not. Note, this isn't as bad as the difference between Intel's TDP-on-the-box and the actual power consumption of its turbo modes, and likely AMD is seeing this market expoitation of TDP vs Turbo as a potential avenue for performance. Ideally we should be getting several numbers on the box explaining this (TDP and PPT), but as of yet I've not seen any desire to do so. As we move into 280W 3rd Gen Threadripper processors, we'll be inspecting those to see if it changes for those as well.
The High-Level Holistic View: Ryzen Wins
In order to put all of our data into a conclusion that was more meaningful, we took the geometric mean of a cross section of our benchmarks. For the cross section of benchmarks, we covered a range of ST and MT tests, and we plotted a number of chips as a function of price.
A geometric mean (or average) is different to a standard average: e.g. if two benchmarks score 100 and 500 on one chip, but 250 and 350 on the other, it gives the same standard average. But, looking at the data, the second test is 33% lower but the first test is 2.5x higher. Ultimately the second chip might overall be better: both chips are equal in a standard average, but the geometric mean recognizes that 2.5x difference vs only a 33% drop and adjusts the value accordingly.
We get this graph:
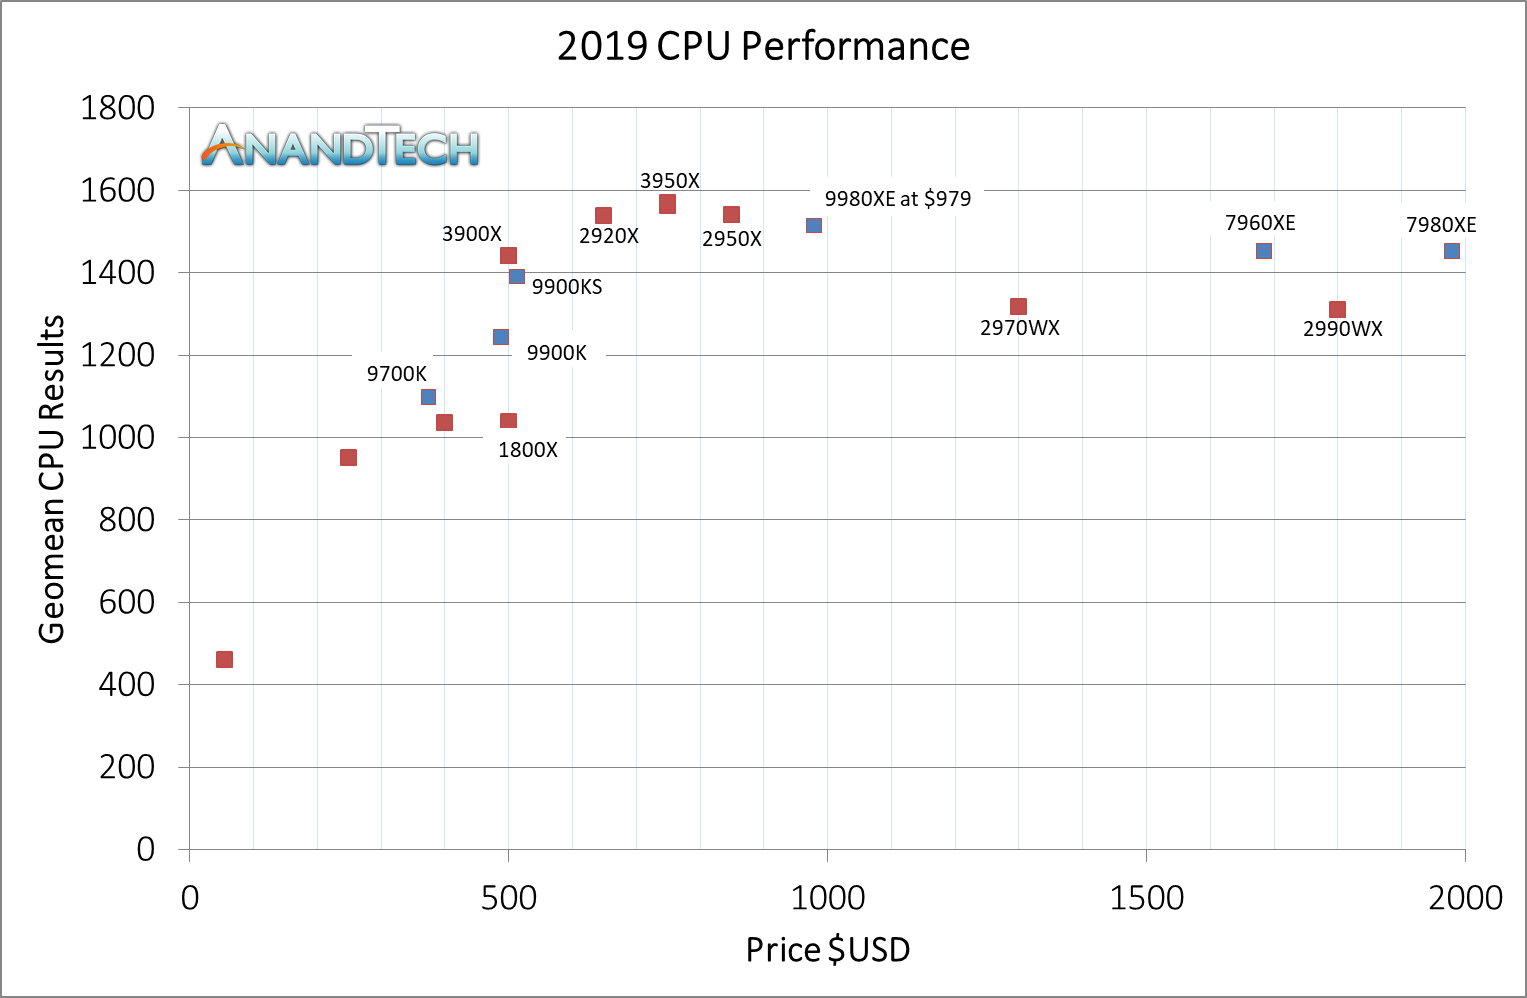
In terms of absolute performance across our benchmark range, the Ryzen 9 3950X has the lead. This metric also puts the 3900X above the 9900KS, because despite the 5.0 GHz all-core on 8-cores, moving to 12-core and 16-core at almost the same performance per core gives more of an advantage in our test suite's MT-heavy workloads. As we move to the more expensive HEDT chips, the 16-core and 18-core from Intel, then even with strong AVX-512 performance, it’s not enough to offset other areas.

For users who want the best without going to the high-end desktop, the Ryzen 9 3950X has the best overall score out of all the chips we’ve ever tested.
If you thought the 3900X didn't have enough power, the 3950X is your answer.
Looking forward, we’re going to have an interesting time with the upcoming HEDT chips from both companies, as users who need HEDT will need something more than what the AM4 has to offer. AMD is set to launch its 3rd Generation Threadripper platform on the 25th, and Intel's Cascade Lake-X CPUs are also due out later this month. Stay tuned for those reviews.


206 Comments
View All Comments
Devo2007 - Thursday, November 14, 2019 - link
First page "As we move into 2019" - should be "As we move into 2020"plp1980 - Thursday, November 14, 2019 - link
Is says as we move "through" not as we move "into"Ryan Smith - Thursday, November 14, 2019 - link
It did originally say "into". We've since fixed it.=)Netmsm - Friday, November 15, 2019 - link
Ryan, why isn't there any Cinebench test?!TheJian - Wednesday, November 20, 2019 - link
Because nobody uses it as Intel said (nobody is 1% or less right?)? Nobody making money is using something that is far slower that PAID products. Pointless to benchmark this in every review, just like it's pointless to test 4k in all vid card reviews when nobody is using that either (ok, nobody here means less than 2%...LOL). Whatever. Surely Ryan is chomping at the bit now to tell me 4k is the new enthusiast standard...LOL. Yeah, wake me when 1440p is, as it still isn't LONG after you said that at 660ti article. Still not even 5% years later, heck, both added up don't hit 7% last I checked (month ago?). 1080p however? 65% of users of 130mil steam gamers (this is pretty accurate for the world elsewhere no doubt). Should test LOADS of 1080p games, and maybe benchmark 1/2 at 1440p, only 1-2 at 4k if at all (should be done once a year or in a separate review of 4k yearly?). Until people use it, quit wasting time.Anandtech (and many others) seem to do a lot of testing that is NOT how a user would do use their PC. Handbrake crap quality etc. Who uses FAST? FASTER? You blind already so blur doesn't matter? Cinebench freeware same story. Intel seems to have a point though they didn't mind before losing massively on all these things they are now whining about.
https://store.steampowered.com/hwsurvey/Steam-Hard...
Yep, still right, not even 5% yet for 1440p, 7% accurate total 4k+1440p still...LOL. Keep dreaming ryan ;)
Netmsm - Sunday, November 24, 2019 - link
impertinent words! These are not the answer.Everybody who works on editing films knows how helpful the Cinebench tests are in specifying which CPU will be faster.
alysdexia - Thursday, November 28, 2019 - link
shall be swifterpeevee - Monday, November 25, 2019 - link
"Anandtech (and many others) seem to do a lot of testing that is NOT how a user would do use their PC."Absolutely. And all their tests get the same amount of space. Including those nobody can use or reproduce. BS all the time, like off-screen rendering, compute on Dolphin emulator, in-house 3DPM... Ancient codecs, irrelevant settings... Somebody needs to bring them back into reality.
Ian Cutress - Tuesday, March 24, 2020 - link
There is. It's in our benchmark database. www.anandtech.com/benchasking - Sunday, July 5, 2020 - link
@Ian Cutress there is significant doubt (in the form of harrasement) being expressed on the forums about your conclusion on page two of this article that the power consumption of Ryzen chips changed (went upward) between Zen+ and Zen 2. Would be interesting to see your further thoughts: https://forums.anandtech.com/threads/will-cpu-supp...