Upgrading from an Intel Core i7-2600K: Testing Sandy Bridge in 2019
by Ian Cutress on May 10, 2019 10:30 AM EST- Posted in
- CPUs
- Intel
- Sandy Bridge
- Overclocking
- 7700K
- Coffee Lake
- i7-2600K
- 9700K
CPU Performance: System Tests
Our System Test section focuses significantly on real-world testing, user experience, with a slight nod to throughput. In this section we cover application loading time, image processing, simple scientific physics, emulation, neural simulation, optimized compute, and 3D model development, with a combination of readily available and custom software. For some of these tests, the bigger suites such as PCMark do cover them (we publish those values in our office section), although multiple perspectives is always beneficial. In all our tests we will explain in-depth what is being tested, and how we are testing.
All of our benchmark results can also be found in our benchmark engine, Bench.
Application Load: GIMP 2.10.4
One of the most important aspects about user experience and workflow is how fast does a system respond. A good test of this is to see how long it takes for an application to load. Most applications these days, when on an SSD, load fairly instantly, however some office tools require asset pre-loading before being available. Most operating systems employ caching as well, so when certain software is loaded repeatedly (web browser, office tools), then can be initialized much quicker.
In our last suite, we tested how long it took to load a large PDF in Adobe Acrobat. Unfortunately this test was a nightmare to program for, and didn’t transfer over to Win10 RS3 easily. In the meantime we discovered an application that can automate this test, and we put it up against GIMP, a popular free open-source online photo editing tool, and the major alternative to Adobe Photoshop. We set it to load a large 50MB design template, and perform the load 10 times with 10 seconds in-between each. Due to caching, the first 3-5 results are often slower than the rest, and time to cache can be inconsistent, we take the average of the last five results to show CPU processing on cached loading.
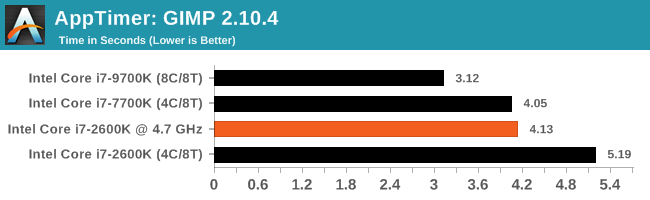
Even overclocked, the 2600K doesn't quite reach the 7700K performance, while the 9700K with the higher single thread frequency takes a healthy lead.
FCAT: Image Processing
The FCAT software was developed to help detect microstuttering, dropped frames, and run frames in graphics benchmarks when two accelerators were paired together to render a scene. Due to game engines and graphics drivers, not all GPU combinations performed ideally, which led to this software fixing colors to each rendered frame and dynamic raw recording of the data using a video capture device.
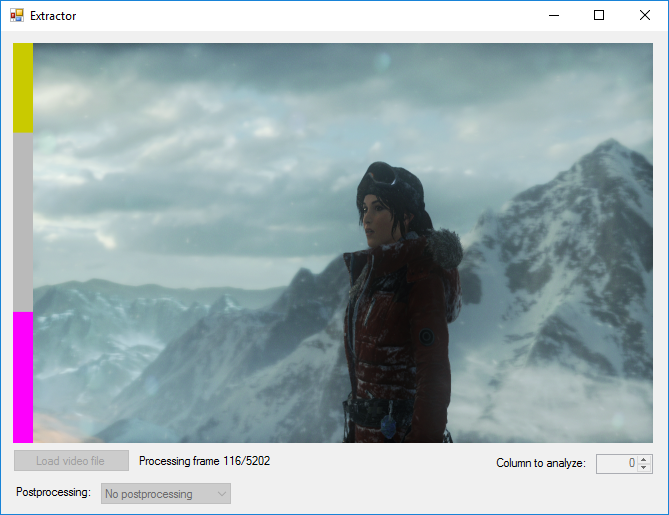
The FCAT software takes that recorded video, which in our case is 90 seconds of a 1440p run of Rise of the Tomb Raider, and processes that color data into frame time data so the system can plot an ‘observed’ frame rate, and correlate that to the power consumption of the accelerators. This test, by virtue of how quickly it was put together, is single threaded. We run the process and report the time to completion.
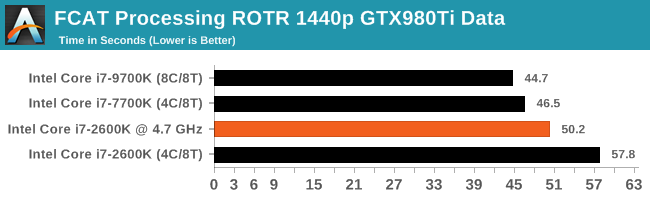
FCAT is another single threaded test, so we're seeing the same performance differences: the 2600K overclocked can't quite match the 7700K at stock, while the 9700K goes out into the lead.
3D Particle Movement v2.1: Brownian Motion
Our 3DPM test is a custom built benchmark designed to simulate six different particle movement algorithms of points in a 3D space. The algorithms were developed as part of my PhD., and while ultimately perform best on a GPU, provide a good idea on how instruction streams are interpreted by different microarchitectures.
A key part of the algorithms is the random number generation – we use relatively fast generation which ends up implementing dependency chains in the code. The upgrade over the naïve first version of this code solved for false sharing in the caches, a major bottleneck. We are also looking at AVX2 and AVX512 versions of this benchmark for future reviews.
For this test, we run a stock particle set over the six algorithms for 20 seconds apiece, with 10 second pauses, and report the total rate of particle movement, in millions of operations (movements) per second. We have a non-AVX version and an AVX version, with the latter implementing AVX512 and AVX2 where possible.
3DPM v2.1 can be downloaded from our server: 3DPMv2.1.rar (13.0 MB)
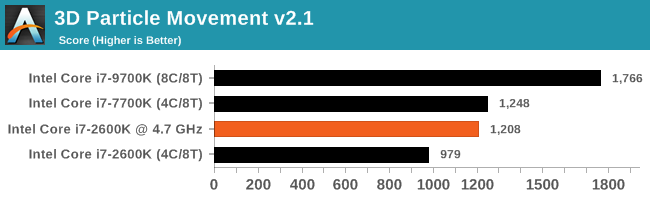
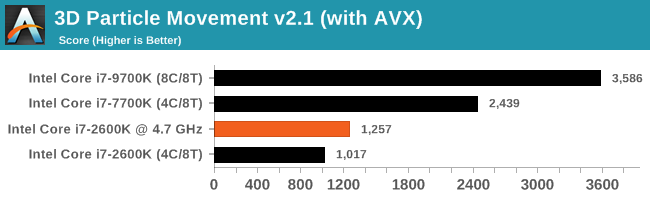
As the 2600K does not have AVX2, it ends up severely lacking behind the 7700K/9700K when the program is optimized for the new instructions.
Dolphin 5.0: Console Emulation
One of the popular requested tests in our suite is to do with console emulation. Being able to pick up a game from an older system and run it as expected depends on the overhead of the emulator: it takes a significantly more powerful x86 system to be able to accurately emulate an older non-x86 console, especially if code for that console was made to abuse certain physical bugs in the hardware.
For our test, we use the popular Dolphin emulation software, and run a compute project through it to determine how close to a standard console system our processors can emulate. In this test, a Nintendo Wii would take around 1050 seconds.
The latest version of Dolphin can be downloaded from https://dolphin-emu.org/
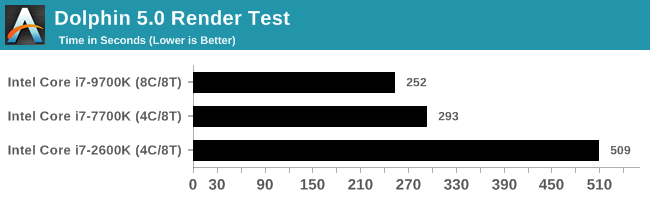
Dolphin gained substantial performance around the Haswell/Broadwell era, hence the incredible performance gain from 2600K to 7700K. Unfortunaetly for some reason the overclocked CPU failed this test.
DigiCortex 1.20: Sea Slug Brain Simulation
This benchmark was originally designed for simulation and visualization of neuron and synapse activity, as is commonly found in the brain. The software comes with a variety of benchmark modes, and we take the small benchmark which runs a 32k neuron / 1.8B synapse simulation, equivalent to a Sea Slug.
Example of a 2.1B neuron simulation
We report the results as the ability to simulate the data as a fraction of real-time, so anything above a ‘one’ is suitable for real-time work. Out of the two modes, a ‘non-firing’ mode which is DRAM heavy and a ‘firing’ mode which has CPU work, we choose the latter. Despite this, the benchmark is still affected by DRAM speed a fair amount.
DigiCortex can be downloaded from http://www.digicortex.net/
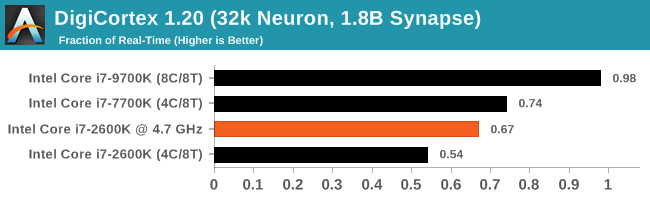
For memory related tests, we ran the systems at their Intel designated supported frequencies, except for the OC system, which got a healthy boost from DDR3-1333 to DDR3-2400. The results show the bump in performance, but even a 7700K at stock wins out. Jumping up to the 9700K gets added core performance.
y-Cruncher v0.7.6: Microarchitecture Optimized Compute
I’ve known about y-Cruncher for a while, as a tool to help compute various mathematical constants, but it wasn’t until I began talking with its developer, Alex Yee, a researcher from NWU and now software optimization developer, that I realized that he has optimized the software like crazy to get the best performance. Naturally, any simulation that can take 20+ days can benefit from a 1% performance increase! Alex started y-cruncher as a high-school project, but it is now at a state where Alex is keeping it up to date to take advantage of the latest instruction sets before they are even made available in hardware.
For our test we run y-cruncher v0.7.6 through all the different optimized variants of the binary, single threaded and multi-threaded, including the AVX-512 optimized binaries. The test is to calculate 250m digits of Pi, and we use the single threaded and multi-threaded versions of this test.
Users can download y-cruncher from Alex’s website: http://www.numberworld.org/y-cruncher/
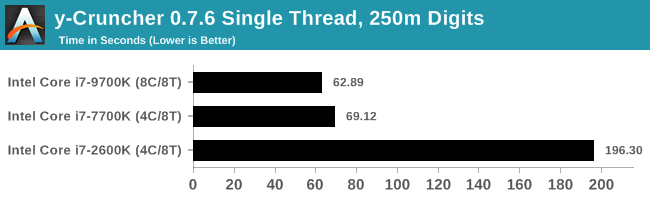
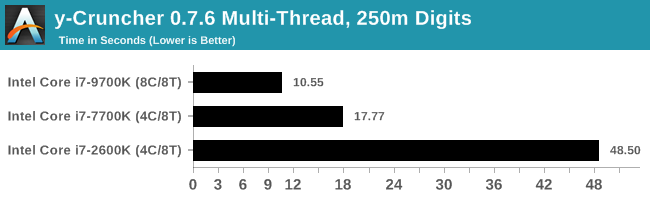
y-cruncher is another benchmark that implements as many AVX acceleration functions as possible, showcasing how newer chips than Sandy Bridge have additional benefits.
Agisoft Photoscan 1.3.3: 2D Image to 3D Model Conversion
One of the ISVs that we have worked with for a number of years is Agisoft, who develop software called PhotoScan that transforms a number of 2D images into a 3D model. This is an important tool in model development and archiving, and relies on a number of single threaded and multi-threaded algorithms to go from one side of the computation to the other.
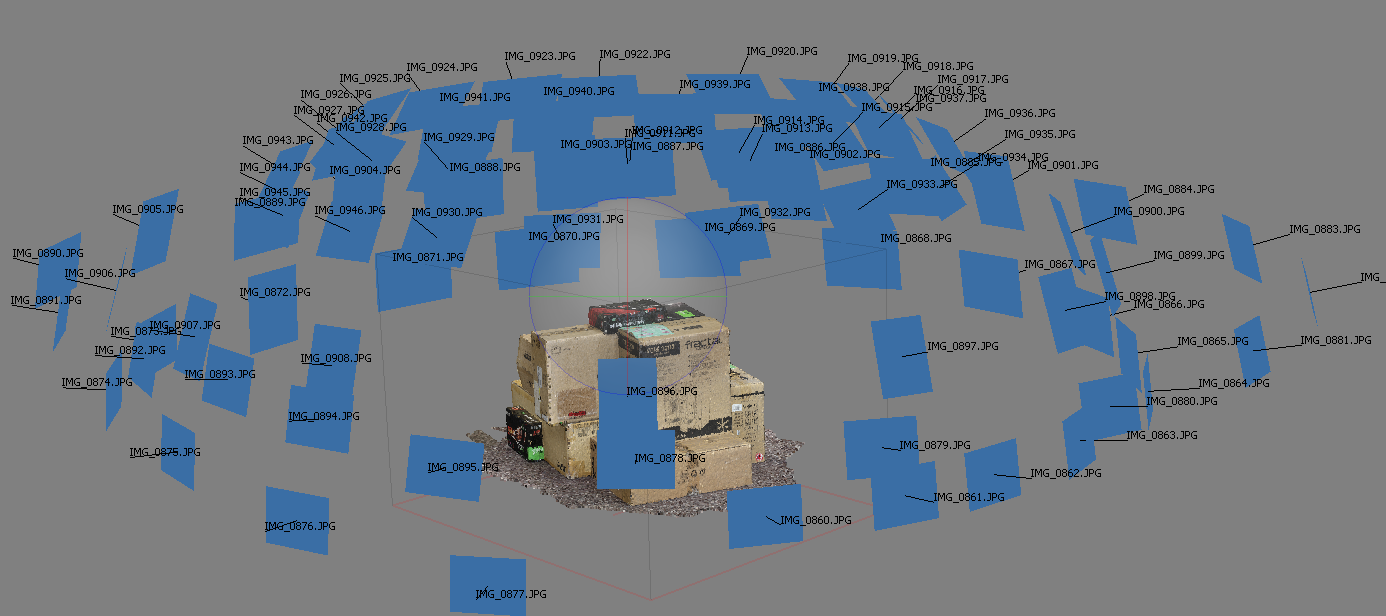
In our test, we take v1.3.3 of the software with a good sized data set of 84 x 18 megapixel photos and push it through a reasonably fast variant of the algorithms, but is still more stringent than our 2017 test. We report the total time to complete the process.
Agisoft’s Photoscan website can be found here: http://www.agisoft.com/
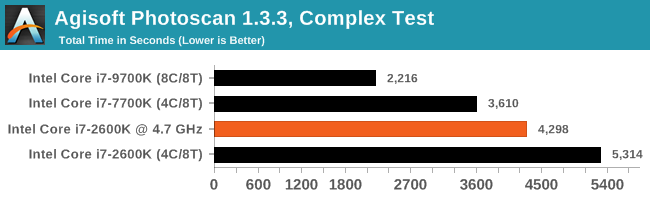
As a variable threaded test, the overclock on the 2600K gives a sizeable performance jump over the stock performance, however the 7700K at stock gets almost the same size jump again. Having more cores in the 9700K just laughs at the rest of the chips in this comparison.


213 Comments
View All Comments
Ironchef3500 - Friday, May 10, 2019 - link
Still running one of these...warreo - Friday, May 10, 2019 - link
same here, it's still running greatNetmsm - Friday, May 10, 2019 - link
No! It dose not run great, this is 9700k that runs very disappointing.flyingpants265 - Saturday, May 11, 2019 - link
Hah, I get your point. But as of this moment, 9700k is one of the best desktop CPUs out there.Netmsm - Saturday, May 11, 2019 - link
:)It'd be better to say 9700k is one of the best Intel's desktop blah, blah, blah.
jgraham11 - Monday, May 13, 2019 - link
9700k can pump out the most frames per second but it is not the best by any means, its utilization it typically more than %80. Just like a few years ago when all those quad cores were doing so great compared to AMDs more cores and more thread approach. Now those quad cores that put out all those frames are struggling to keep up in modern titles, those AMD processors are still putting out descent frame rates! Another example of AMD's fine wine technology.With that said, is the frames per second really a good metric to determine longevity of a processor?? Or should be looking at CPU utilization as well.
lmcd - Thursday, January 21, 2021 - link
This article is old but "fine wine" about AMD's old processors is pure delusion. 2600k-age AMD looks horrible. Bulldozer was always horrible, and Piledriver has looked worse with age. Even Excavator gets absolutely smoked by most old Intel CPUs. While obviously not identical and much higher power, an Intel 3960X still went even with nearly every Ryzen 1 CPU. Fine wine my ass.yankeeDDL - Sunday, May 12, 2019 - link
Actually, this is a pretty fair summary. The 9700K, 9 years later, offers about 40% advantage over the 2600 (except in gaming, where more cores don't matter, today), which is quite abysmal.Vayra - Monday, May 13, 2019 - link
More cores don't matter? What results have you been looking at for gaming? 4K ultra?yankeeDDL - Monday, May 13, 2019 - link
Obviously, I was referring at the article. "More cores" meant going from 4 of the 2600 to 8 of the 9700. And no, they don't matter, unless you see a benefit of running at 300fps instead of 250fps. At high res, when the fps start coming close to 60fps, the 2600 and the 9700k are basically equivalent.A different story would be going from 2 to 4, but this would have nothing to do with the article...
Is it clear now?