LeadTek 6800 and eVGA 6800 Ultra Extreme: New GeForce on the Block
by Derek Wilson on July 9, 2004 1:00 AM EST- Posted in
- GPUs
The Cards
First up, we have the LeadTek GeForce 6800. As with most (all?) cards at this stage in the game, this is just a reference card with a LeadTek HSF solution strapped on it. Of course, cooling solution can play a large role in purchasing decisions, and as we saw in our previous generation round up, the LeadTek doesn't have a bad design at all.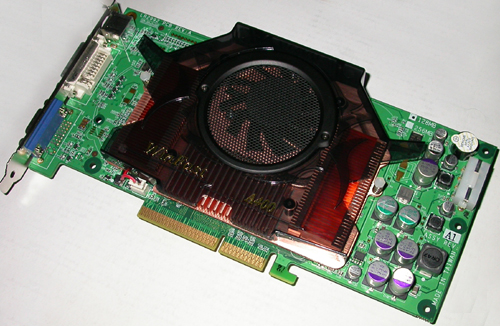
The core clock speed of the NVIDIA GeForce 6800 is 325, and memory is clocked at a relatively low 700MHz data rate, and it only has 128MB of RAM. Of course, the 400MHz drop in memory speed from its 16-pipe Ultra flavored big brother isn't as large a deal as it could be. The number of pixel pipelines running has a heavy impact on memory usage. Since this only has 12 pipes running at a lower clock speed, the slower (and cheaper) memory selection shouldn't have as large an impact as it might seem.
Pricing on the 6800 is looking to be about $300 USD.
Next up is the eVGA GeForce 6800 Ultra Extreme Edition. These Extreme cards will simply be highly overclocked 6800 Ultra GPUs. NVIDIA suggests 450MHz+ core and 1.1GHz+ memory. Vendors who decide to pick up one of these overclockable GPUs can (and probably should) decide to go with faster memory as well. A beefy cooling solution is also desirable. Our digging and prodding suggests that NVIDIA doesn't charge any more or less for this chip to vendors (though they don't discuss at what price they will sell their chips), since it's still a 6800 Ultra GPU, but only some vendors will be able to get their hands on them.
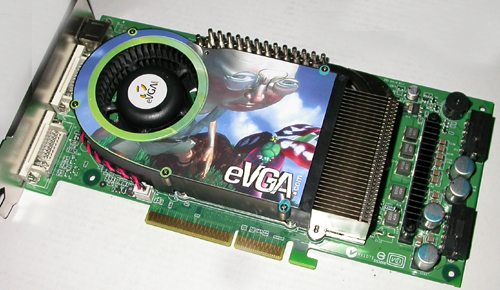
As we can see from the picture, this card is totally stock NVIDIA with the exception of the Tonberry image on the fan shroud rather than the mermaid. This particular 6800UE has a core clock speed of 450MHz and a memory data rate of 1.2GHz. We received our sample clocked at 460, but later received an update from eVGA that they would be shipping them at a lower speed. As we saw in our FarCry v1.2 patch article, this card was perfectly stable at 460 MHz, though mileage may vary.
We don't have any pricing information on the 6800 Ultra Extreme, but it will likely be very high as Ultras are going for $540 USD. We have been told by eVGA that the Ultra cards should retail for $500 while the Ultra Extremes should be $540, but vendors are simply selling the lower powered cards at a higher price right now. It remains to be seen what will happen with this, but price won't stabalize before availability does. For now, our greater concern is street price, which we estimate will be much higher than $540 (at least initially). But eVGA maintains that the card should be priced at $540 on their website when it becomes available. For that, we will have to wait and see.
Our comparisons will include plenty of ATI and NVIDIA current and previous generation cards.


46 Comments
View All Comments
TrogdorJW - Tuesday, July 13, 2004 - link
Regarding the logarithmic scale, again, I don't think that it was a really bad idea. It tries to equalize scores that really have a lot of variables. What would be the best way of measuring bang-for-the-buck? Well, here's what I think would actually have to come into consideration.Well, you would have to take into account the desired average frame rate. This of course varies from game to game, but a score of somewhere between 60 and 100 FPS would probably be ideal. Of course, this would vary between games, as a game like Unreal Tournament 2004 "needs" higher frame rates more than something like Flight Simulator 2004 (or whatever we're on now).
Why 100, when you can't really "see" things that fast? Well, ideally, you would want V-synch enabled for maximum image quality. 100 FPS without V-synch would probably get pretty close to your refresh rate, i.e. 85 Hz, with V-synch. Meanwhile, 60 FPS with an 85 Hz refresh rate might end up scoring more like 42.5 FPS with V-synch enabled. Even worse, 59 FPS with a 60 Hz refresh rate might score as low as 30 FPS.
Anyway, the scale would be weighted, so scores lower than this threshold would be punished increasingly more, while scores above this threshold give diminishing returns. In other words, if we're shooting for 60 FPS, a score of 55 is pretty close, so it gets maybe 89% on a relative scale (instead of the mathematical 91.7%), while a score of 50 might only get 75% (instead of 83.3%) and a score of 45 might get 55% (instead of 75%). Meanwhile, 70 FPS might score 110% (instead of 116.7%) and 80 might score 115% (instead of 133.3%). That's just a rough example to illustrate what I'm talking about - no actual formula was used there.
You might want to consider *minimum* frame rates (although the weight given to the average frame rate does accomplish *some* of this). So maybe we want a minimum frame rate of 40 FPS, and again its weighted so that dropping below this hurts more, while exceeding this value benefits less. And maybe there should be some factor taking into account the percentage of time that a card drops below this threshold?
Price is also a factor. Some people have limits, so you would have an inversely weighted price scale based off your target. Say you want to spend $200. Cards costing less than that would be more desirable, even with lower performance, while cards costing more would be less desirable.
You can go on with all sorts of ideas. In the end, though, it ends up being far too complex for anyone but a mathematics professor. So, the log scale rating that was used isn't terrible... it's just a little interesting, since a straight scale is more easily calculated, more people are familiar with it, and some would say it’s more “accurate” (although that last is more opinion than anything).
jiulemoigt - Monday, July 12, 2004 - link
hummm also Doom3 is confirmed for quakecon so the next game to kick your pc's (whatever) is due to come out next month should be interessting to see if any of the value cards can handle it.DerekWilson - Sunday, July 11, 2004 - link
our grphing engine doesn't display log scale. I went to all this trouble to get around that :-)Also, we will get color coding in our graphing engine sometime soon, but we don't have it yet ...
Normalizing everything to avg fps and avg cost wouldn't be as useful if done on a per graph basis (which it would have to be done on)... Unless you picked an arbitrary normalization point like desireable fps across all games and desireable cost for that fps .... but that's too sticky and specific ... You have a good idea, but i don't think it would be straight forward to impliment --- we'll see what we can do with this though, thanks.
Pumpkinierre - Sunday, July 11, 2004 - link
Normalise all the results to the average fps/cost of all the cards. Any card close to the normal average(1 or 100 if x100) will be a reasonable to good buy and the outer extremes will be accentuated while still being contained (unlike logarithmic representation that distort the comparison).trexpesto - Saturday, July 10, 2004 - link
Hmm, can your graph generator show a log scale? Then maybe you can use the raw fps/$ numbers but it would be at the display level that the scaling was done.trexpesto - Saturday, July 10, 2004 - link
Not sure I like the log scaling.Looking at http://anandtech.com/video/showdoc.aspx?i=2113&...
in the first graph with no AA/AF the scores for 9800XT vs 6800NP are 12.2 and 14.9 respectively.
So:
9800XT 66fps/$400 = .165 AT-score = 12.2
6800NP 93fps/$300 = .31 AT-score = 14.9
So the fps/$ is almost double but the AT-score is about one-fifth increase.
Not that anyone will ever pay 400 for an 9800XT again - vendors are you listening?
AtaStrumf - Saturday, July 10, 2004 - link
You might wonna improve the presentation of your results (at least in the Final Words page) by putting them in as few as possible tables (and add/or only use relative results (%) beside actual FPS (mandatory for the GPU which represents 100% or 1,00), to better relate the difference in perfomance -- now being represented by graph bars length which is not that accurate) instead of hundrets of graphs on tens of pages. It makes getting a good overview and doing quick comparisons very hard. You can also use some creative color coding (green = good, red = bad, etc.) to futher increase the readability of these tables. You have done a bit of this in some of your more recent reviews and I'd like see you do it even more and even step it up a notch or two.DerekWilson - Saturday, July 10, 2004 - link
as for the log scale ...if we had said:
Value = fps / price
we would have had tiny values which look really bad on our graphs :-) So our first option was to scale the graphs up by multiplying by 100:
Value = 100 * fps / price
The problem with this is that the visual impact of the scaling seemed too dramatic. Now, we don't mean with the high priced ultrasuperextremegold cards. The problem was the difference between the X800 Pro and the 6800GT ... The GT certainly comes out on top, but we are talking about current market prices and a difference of $10. We didn't want to give this difference (the cost of a couple value meals at the local fast food place) more weight than people might ascribe it.
Of course, there are infinite other ways to look at this. Is frame rate *REALLY* important to you? Then its perfectly valid to look at this graph:
Value = fps^2 / price
or is cost the absolute driving factor to you?
Value = fps / price^2
Its all relative really, and very hard to determine. We just wanted to show which cards will give you more frames per dollar, but we didn't want to ascribe a dollar value to every frame ... So the log scale seemed to be our best bet.
But we are definitely open to feedback on how we approach value from a quantitative standpoint. Please let us know what you think, or if there is a better way to approach the issue.
Thanks!
DerekWilson - Saturday, July 10, 2004 - link
Warcraft III is an interesting game. It is a DX8 game, but OpenGL rendering can be enabled with a commmandline switch. In doing some testing, we noticed that OGL mode gets MUCH higher frame rates on both cards (if you talk to some hard core wc3 freaks out there, they might already enable OGL mode to keep framerate up).We spoke with Blizzard about the differences between the DX8 and OGL rendering paths. Specifically, we wanted to know if there was a quality difference that would make the OGL path run faster than the DX8 path. Blizzard informed us that the two paths had converged on the same quality level. They would not say that the DX8 and OGL paths rendered the exact /same/ image, but they maintained that the only reason they didn't was that DX8 and OGL can't rendere the exact same pixels in certain situations.
We may taclke some OGL benches in WC3 in the future if people are interested. But since we're trying to show realworld performance in these benches, and DX8 is what most people will use, we haven't felt like including these numbers would be useful for now.
Blizzard didn't say anything about capping framerates in DX8, but, then, we didn't ask that question specifically.
Marsumane - Friday, July 9, 2004 - link
Actually WCIII is DX8 based. Also, wc3 is quite odd with graphic cards. Even with a high end cpu, on toms hardware, the cards dont exactly scale evenly as they do in other benchmarks. Its like theres a cap placed on them in the engine or ATI's drivers dont have some sort of cap on them. I believe it is in the engine due to all cards seeming to have similar frames dispite the card used (unless AA or AF is turned on). The ati cards have a slightly lower cap it seems. I mean the difference is like 3fps between the 9700p and the 6800U. It makese no sense why they all stop here.