The $60 CPU Question: AMD Athlon 200GE or Intel Pentium Gold G5400? A Review
by Ian Cutress on January 14, 2019 8:00 AM ESTCPU Performance: System Tests
Our System Test section focuses significantly on real-world testing, user experience, with a slight nod to throughput. In this section we cover application loading time, image processing, simple scientific physics, emulation, neural simulation, optimized compute, and 3D model development, with a combination of readily available and custom software. For some of these tests, the bigger suites such as PCMark do cover them (we publish those values in our office section), although multiple perspectives is always beneficial. In all our tests we will explain in-depth what is being tested, and how we are testing.
All of our benchmark results can also be found in our benchmark engine, Bench.
Application Load: GIMP 2.10.4
One of the most important aspects about user experience and workflow is how fast does a system respond. A good test of this is to see how long it takes for an application to load. Most applications these days, when on an SSD, load fairly instantly, however some office tools require asset pre-loading before being available. Most operating systems employ caching as well, so when certain software is loaded repeatedly (web browser, office tools), then can be initialized much quicker.
In our last suite, we tested how long it took to load a large PDF in Adobe Acrobat. Unfortunately this test was a nightmare to program for, and didn’t transfer over to Win10 RS3 easily. In the meantime we discovered an application that can automate this test, and we put it up against GIMP, a popular free open-source online photo editing tool, and the major alternative to Adobe Photoshop. We set it to load a large 50MB design template, and perform the load 10 times with 10 seconds in-between each. Due to caching, the first 3-5 results are often slower than the rest, and time to cache can be inconsistent, we take the average of the last five results to show CPU processing on cached loading.
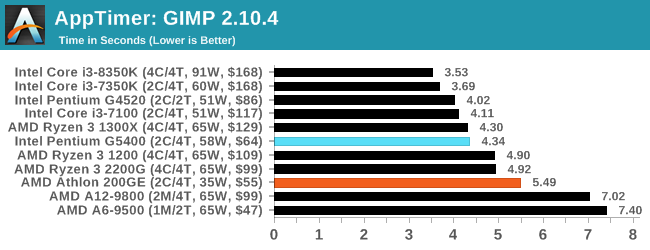
As a single threaded test, application loading is a key part of the user experience. Unfortunately the AMD 200GE is 21% slower in this case.
FCAT: Image Processing
The FCAT software was developed to help detect microstuttering, dropped frames, and run frames in graphics benchmarks when two accelerators were paired together to render a scene. Due to game engines and graphics drivers, not all GPU combinations performed ideally, which led to this software fixing colors to each rendered frame and dynamic raw recording of the data using a video capture device.
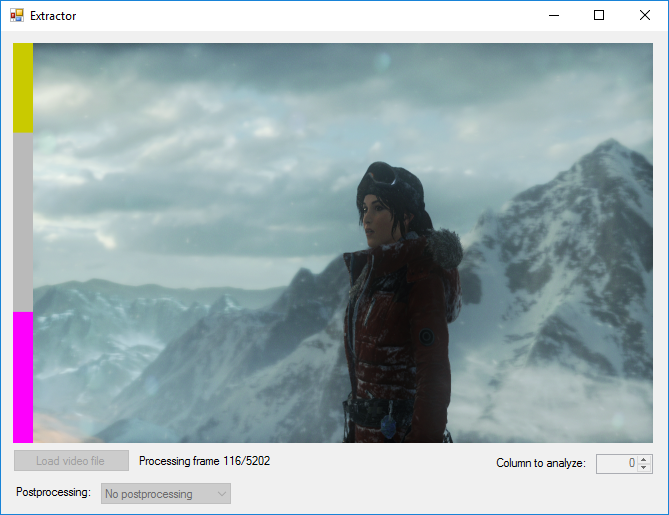
The FCAT software takes that recorded video, which in our case is 90 seconds of a 1440p run of Rise of the Tomb Raider, and processes that color data into frame time data so the system can plot an ‘observed’ frame rate, and correlate that to the power consumption of the accelerators. This test, by virtue of how quickly it was put together, is single threaded. We run the process and report the time to completion.
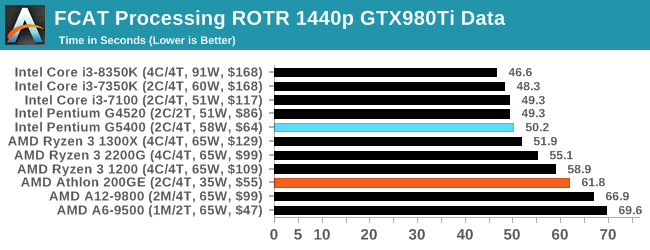
In a similar light, the single threaded nature of this test shines on an AMD processor that is 18.6% slower than the Intel competition.
3D Particle Movement v2.1: Brownian Motion
Our 3DPM test is a custom built benchmark designed to simulate six different particle movement algorithms of points in a 3D space. The algorithms were developed as part of my PhD., and while ultimately perform best on a GPU, provide a good idea on how instruction streams are interpreted by different microarchitectures.
A key part of the algorithms is the random number generation – we use relatively fast generation which ends up implementing dependency chains in the code. The upgrade over the naïve first version of this code solved for false sharing in the caches, a major bottleneck. We are also looking at AVX2 and AVX512 versions of this benchmark for future reviews.
For this test, we run a stock particle set over the six algorithms for 20 seconds apiece, with 10 second pauses, and report the total rate of particle movement, in millions of operations (movements) per second. We have a non-AVX version and an AVX version, with the latter implementing AVX512 and AVX2 where possible.
3DPM v2.1 can be downloaded from our server: 3DPMv2.1.rar (13.0 MB)
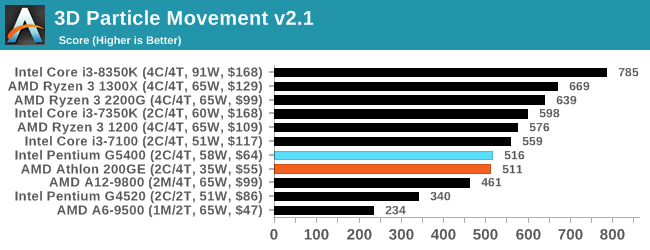
For pure unoptimized throughput, both processors are similar in the 3DPM test.
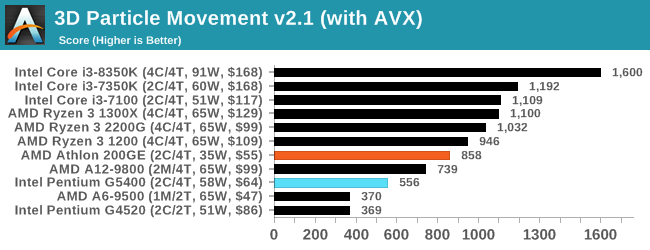
But if we crank on the tuned AVX code, the AMD 200GE scores a big win. On the Pentium, the different code path had almost zero effect, with less than a 10% increase in performance, but the 200GE went up by a good 60% by comparison.
Dolphin 5.0: Console Emulation
One of the popular requested tests in our suite is to do with console emulation. Being able to pick up a game from an older system and run it as expected depends on the overhead of the emulator: it takes a significantly more powerful x86 system to be able to accurately emulate an older non-x86 console, especially if code for that console was made to abuse certain physical bugs in the hardware.
For our test, we use the popular Dolphin emulation software, and run a compute project through it to determine how close to a standard console system our processors can emulate. In this test, a Nintendo Wii would take around 1050 seconds.
The latest version of Dolphin can be downloaded from https://dolphin-emu.org/
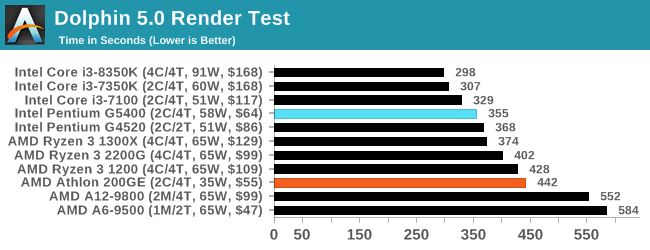
Our emulation test has always been a strong performer for Intel CPUs.
DigiCortex 1.20: Sea Slug Brain Simulation
This benchmark was originally designed for simulation and visualization of neuron and synapse activity, as is commonly found in the brain. The software comes with a variety of benchmark modes, and we take the small benchmark which runs a 32k neuron / 1.8B synapse simulation, equivalent to a Sea Slug.
We report the results as the ability to simulate the data as a fraction of real-time, so anything above a ‘one’ is suitable for real-time work. Out of the two modes, a ‘non-firing’ mode which is DRAM heavy and a ‘firing’ mode which has CPU work, we choose the latter. Despite this, the benchmark is still affected by DRAM speed a fair amount.
DigiCortex can be downloaded from http://www.digicortex.net/
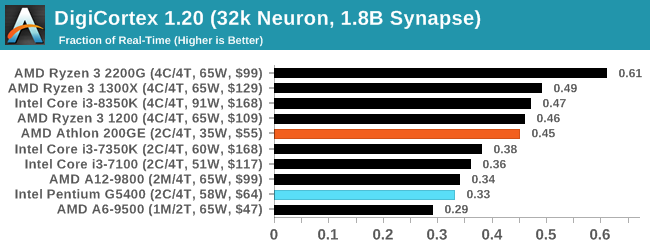
On this more memory limited test, the official supported frequency of the 200GE comes into play, and it scores 37% more than the Intel chip.
y-Cruncher v0.7.6: Microarchitecture Optimized Compute
I’ve known about y-Cruncher for a while, as a tool to help compute various mathematical constants, but it wasn’t until I began talking with its developer, Alex Yee, a researcher from NWU and now software optimization developer, that I realized that he has optimized the software like crazy to get the best performance. Naturally, any simulation that can take 20+ days can benefit from a 1% performance increase! Alex started y-cruncher as a high-school project, but it is now at a state where Alex is keeping it up to date to take advantage of the latest instruction sets before they are even made available in hardware.
For our test we run y-cruncher v0.7.6 through all the different optimized variants of the binary, single threaded and multi-threaded, including the AVX-512 optimized binaries. The test is to calculate 250m digits of Pi, and we use the single threaded and multi-threaded versions of this test.
Users can download y-cruncher from Alex’s website: http://www.numberworld.org/y-cruncher/
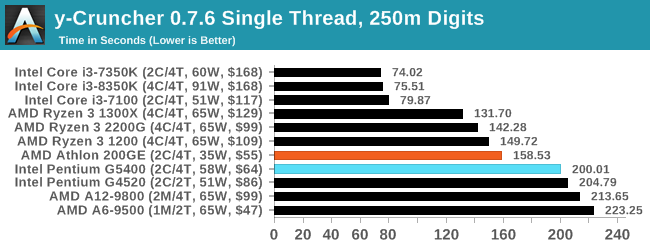
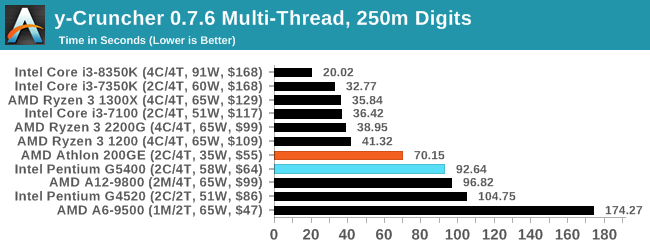
For our second AVX optimized test, AMD again scores a win. It would appear that the Pentium chips from Intel do not seem to be implementing the performance uplifts we see with the Core models.
Agisoft Photoscan 1.3.3: 2D Image to 3D Model Conversion
One of the ISVs that we have worked with for a number of years is Agisoft, who develop software called PhotoScan that transforms a number of 2D images into a 3D model. This is an important tool in model development and archiving, and relies on a number of single threaded and multi-threaded algorithms to go from one side of the computation to the other.
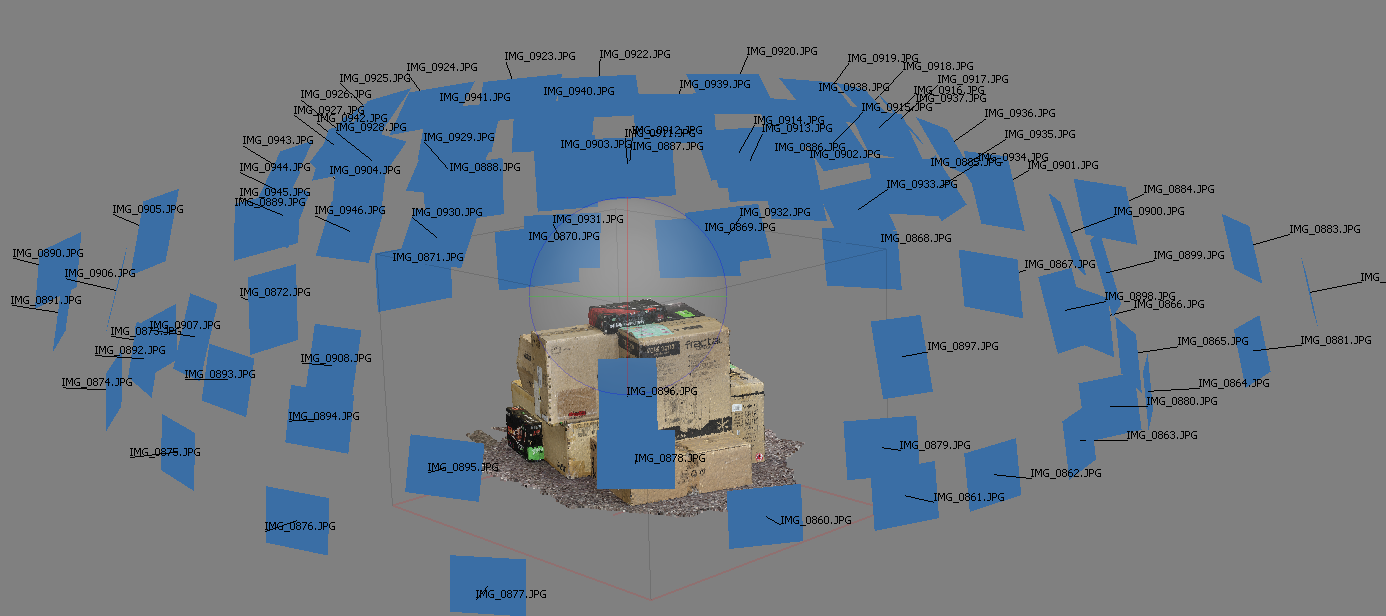
In our test, we take v1.3.3 of the software with a good sized data set of 84 x 18 megapixel photos and push it through a reasonably fast variant of the algorithms, but is still more stringent than our 2017 test. We report the total time to complete the process.
Agisoft’s Photoscan website can be found here: http://www.agisoft.com/
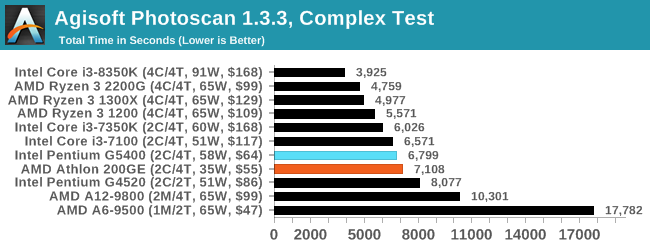
Photoscan is more of a mixed workload, with multithreaded and singlethreaded steps to get a good sense of a performance. The Intel processor slips a win here, a few percent faster than the AMD.


95 Comments
View All Comments
brakdoo - Monday, January 14, 2019 - link
The reason why I bought the 200GE last month: The 5400 is 75€+ and was above 80 when I bought my parts in my country. The Intel shortage makes it easy to decide but I that it'll be over soon.BTW: Does graphics performance have an influence on WebGL stuff like google maps or isn't that challenging enough?
blu42 - Monday, January 14, 2019 - link
Shouldn't 'measured under heavy load' suggest a heavy load for the entire package, not the CPU cores alone?Robotire - Monday, January 14, 2019 - link
This. I’m surprised a pure CPU (I think?) load was used. I would be interesting to know power usage while gaming.Also I’m more likely to buy a component that uses less power… but I guess some SUV owners might prefer it the other way.
Otherwise it’s a very interesting article, thanks! I don’t care at all about overpriced products, but reviews like this one are useful.
SaturnusDK - Monday, January 14, 2019 - link
It's important to note that even if you could get a G5400 at the $64 MSRP, it would be 16% more expensive than the $55 Athlon. However, you can't get the G5400 for $64. The lowest price I have ever seen it retail at is $80 which makes the choice for a absolutely bottom bin bargain buyer easy.If you're still even contemplating the G5400 at it's actual $80 price tag then it would be wise to consider if you can go the extra $20 and get the vastly superior 2200G instead.
Drumsticks - Monday, January 14, 2019 - link
As of right now, the Pentium G5400 is $129.99 on Newegg (??????) and $101 on Amazon from an alternate seller. OTOH, the Athlon 200GE is readily available from both for $60. That's a pretty stark difference.ikjadoon - Monday, January 14, 2019 - link
The pricing is out of whack at Newegg: G5400 for $129, G5500 (3.8GHz w/ UHD630) for $114, and G5600 (3.9GHz w/ UDH630) for $113.You save $16...while buying a higher-end part.
B&H Photo has it for slightly-less absurd 24% markup over MSRP ($80): https://www.bhphotovideo.com/c/product/1393125-REG...
khanikun - Tuesday, January 15, 2019 - link
Ya, the G5400 makes no sense with it's pricing. An i3 8100 is a quad core 3.6 ghz proc with UHD630 for $119. Unless power usage is a main concern, I wouldn't bother with any of those G procs currently. Until prices drops, doesn't make much sense to buy them.Zim - Saturday, January 19, 2019 - link
$65 at Fry's https://www.frys.com/product/9499961StevoLincolnite - Tuesday, January 15, 2019 - link
Even in Australia... The G5400 is $129. - Doesn't make sense to grab that when you can get the Ryzen 3 2200G for $155... You could probably find a motherboard that reduces that $26 pricing gap.Otherwise the 200GE is $79... $50 cheaper.
The G4920 is more inline with the 200GE's price at $89 currently... And at that point, the 200GE is still the decided victor.
PVG - Monday, January 14, 2019 - link
I think TDP has to cover simultaneous heavy usage of both the CPU and IGP. POV-Ray only really stresses the CPU side.I see how one can disregard the IGP contribution on higher end chips, but on models like this, where there's a big chance the IGP will actually be put to use, I fell it should be taken into account, on the power measuring front.