Retesting AMD Ryzen Threadripper’s Game Mode: Halving Cores for More Performance
by Ian Cutress on August 17, 2017 12:01 PM ESTAnalyzing Creator Mode and Game Mode
In this review, we posted every graph with both the Creator Mode results (as default) and the Game Mode results (as 1950X-GM) for the Threadripper 1950X. There were a number of trends worth pointing out.
The first big answer is that in (almost) every multi threaded benchmark that relied on all the threads pushing out data, Game Mode scored considerably less than Creator Mode. In our test suite, I earmarked 19 different tests that are designed to scale with thread count, and the results ranged from +1% (Octane) down to -48% (Corona) and -45% (LuxMark). To summarize, anything that wanted serious throughput, Game Mode was not the right mode to be in. But anyone could have told you that.
The next element is the single threaded tests in the suite. There are 10 of these if we include the four legacy benchmarks, and for the most part these are all within 5% of the Creator Mode results – some are above and some are below, but nothing majorly drastic. Two of the benchmarks, however, did get significant jumps from using Game Mode: Dolphin (+9%) and Agisoft Stage 3 (+38%). Agisoft is probably a hollow victory as overall that test only gains by 1%.
We do run a few variable threaded loads, and the results here really depend on how much of a parallel task it is. As stated before, Agisoft goes up 1%, and perhaps surprisingly our Compile benchmark goes down 14%. One would have thought that the faster memory latency of Game Mode might counteract the lack of threads, especially when the L3 victim cache is of little use, but overall it would seem that our compile test likes the threads instead. WinRAR is a known memory-loving test, so Game Mode picked up a 3% win, and the web benchmarks that are variable threaded such as WebXPRT also picked up a 9% win.
CPU Gaming Tests
Now we turn to our gaming tests. Because we test six different games with four different GPUs at two different resolutions, and in each case take averages and 99th percentiles, I’m going to present this data in a set of different ways. First, the overall gains based on the resolution:
| Game Mode Gains Over Creative Mode | ||
| 1080p | 4K | |
| Average | +0.6% | +0.6% |
| 99th | +14.3% | +8.0% |
The two elements we can draw here are that Game Mode is beneficial mostly for 99th percentiles, but also it affects 1080p gaming over 4K gaming more.
This next table breaks it down by graphics card:
| Game Mode Gains Over Creative Mode | ||
| NVIDIA GTX 1080 | 1080p | 4K |
| Average | -3.1% | 0.0% |
| 99th | +1.6% | +1.9% |
| NVIDIA GTX 1060 | 1080p | 4K |
| Average | -0.6% | +0.1% |
| 99th | +3.1% | +1.9% |
| AMD R9 Fury | 1080p | 4K |
| Average | +2.5% | +1.5% |
| 99th | +26.2% | +14.4% |
| AMD RX 480 | 1080p | 4K |
| Average | +3.6% | +0.6% |
| 99th | +25.0% | +14.1% |
Again, the data shows that 99th percentiles fare better over averages, although the AMD cards get a better uplift than the NVIDIA cards.
Now let us break it down by game tests.
| Game Mode Gains Over Creative Mode | ||
| Civilization 6 | 1080p | 4K |
| Average | -2.1% | -1.8% |
| 99th | -5.3% | -3.1% |
| Ashes of the Singularity | 1080p | 4K |
| Average | -3.2% | -0.1% |
| 99th | -2.2% | -0.6% |
| Shadow of Mordor | 1080p | 4K |
| Average | -0.3% | 0.0% |
| 99th | -4.5% | +0.1% |
Both Civilization 6 and Ashes of The Singularity slight decreases running in Game Mode, with 4K Civilization even regresses 5% in 99th percentile data. Shadow of Mordor has some gains at 4K, mainly with 99th percentile data, but well within the margin of error.
| Game Mode Gains Over Creative Mode | ||
| RoTR-1 | 1080p | 4K |
| Average | -1.3% | +0.1% |
| 99th | +4.2% | +0.4% |
| RoTR-2 | 1080p | 4K |
| Average | +2.4% | +1.8% |
| 99th | +43.7% | +21.9% |
| RoTR-3 | 1080p | 4K |
| Average | +2.3% | +1.4% |
| 99th | +17.9% | +11.7% |
Rise of the Tomb Raider has three test stages, and almost all of them benefit from Game Mode. Again, 99th percentiles go up (+43.7% for the Prophets Tomb test), and 1080p gets the better deal over 4K data.
| Game Mode Gains Over Creative Mode | ||
| Rocket League | 1080p | 4K |
| Average | +0.8% | +1.0% |
| 99th | +9.1% | +2.9% |
| Grand Theft Auto V | 1080p | 4K |
| Average | +6.9% | +2.2% |
| 99th | +49.2% | +29.4% |
The last two games are Rocket League and Grand Theft Auto, with Rocket League getting a small bump in 99th percentiles but GTA jumps up double digits. For GTA, those big number spikes at 1080p come from ~100% gains on AMD cards. Similarly at 4K, while NVIDIA cards get nearly no benefit, AMD cards gain 50-73%.
Conclusions on CPU Gaming
Looking at the overall data, the worst loss was a -10% at 4K for Civilization 6, and it's almost a complete mix of positive and negative results across the 256 data points we tested. The takeaway is that on average Game Mode affects certain games really, really well, like RoTR and GTA, but not games like Ashes or Shadow of Mordor. On average that equates to a +8% boost in 99th percentile frame rates at 4K or a +14% boost in 99th percentile frame rates at 1080p, and mostly limited to AMD cards.
If a user wants to use Threadripper to play certain games when using an AMD card, they should be in Game Mode. There are some losses in some titles, but as a catch all situation, the gains for games where it does work are noticable, espeically at lower resolutions.
How Does it Compare to How We Tested on 16C/16T
Interestingly, the results for almost all benchmarks were lower in 8C/16T mode over 16C/16T mode. Despite moving down to a single die worth of cores, it would appear that having the raw cores at the disposal counteracts most of the cross communication losses, especially if each die of cores preferentially communicates with its own DRAM channels where possible.
In the following table,
On the left is AMD's Game Mode vs Creative Mode.
On the right is SMT disabled vs Creative Mode.
Both non-Creative data sets have NUMA enabled.
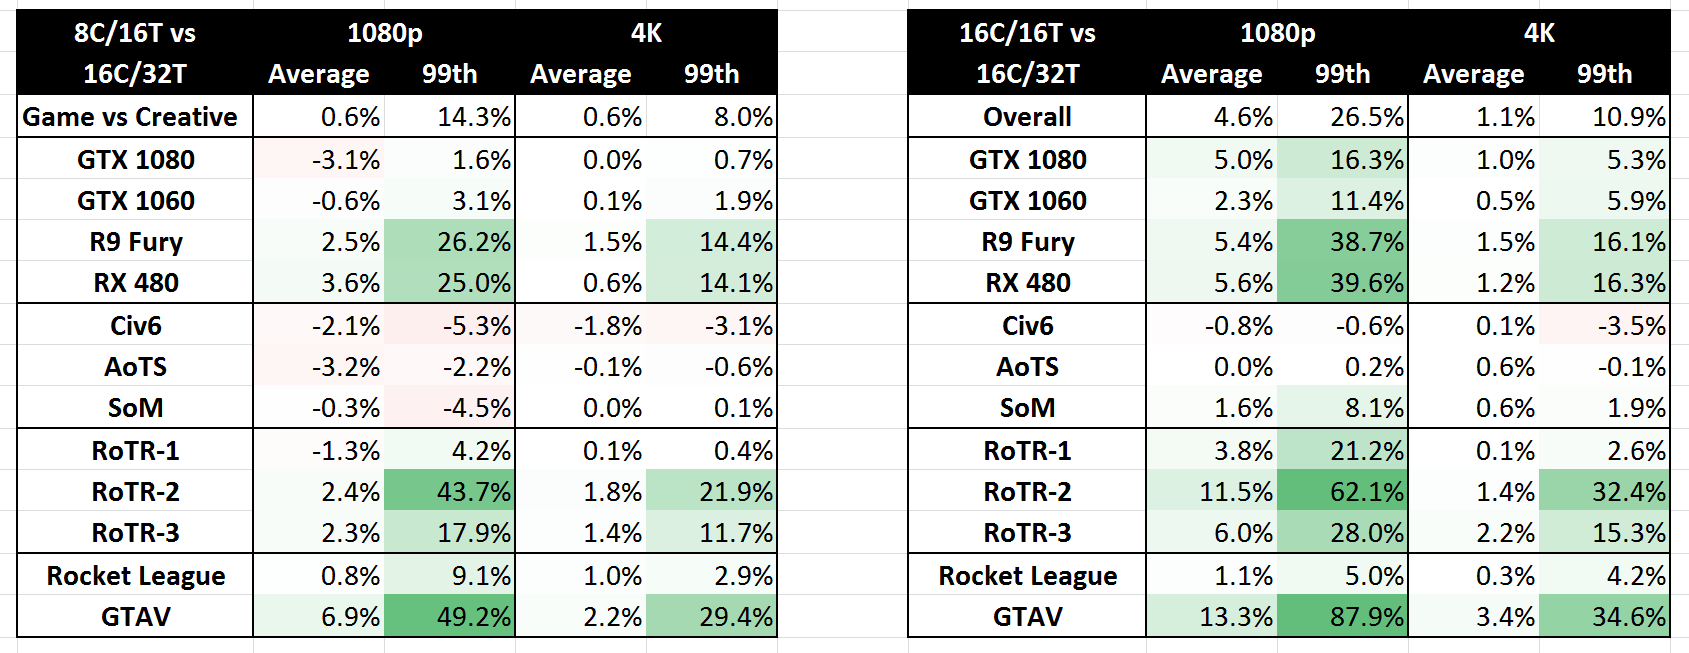
For example, at 16C/16T we saw a +4% average FPS improvement at 1080p, but now at 8C/16T this is only 0.6%. Before we had a +26.5% gain in 99th percentile numbers at 1080p, but now this is only +14.3%. The individual game numbers are matched similarly - on the right at 1080p at 16C/16T, we get an ~0.1% difference in the results for Game Mode compared to Creator mode, but on the left at 8C/16T we see an average loss of 3% for some of the tests. In the pure CPU benchmarks, at 16C/16T some benchmarks like Dolphin had a +33% increase, but at 8C/16T it is only a +9% increase.
The only upside to running at 8C/16T over 16C/16T would seem to be power consumption. In 8C/16T Game Mode, we saw an all-thread power consumption of 125W. In the non-SMT mode, this was 170W, closer to the default Creative Mode of 177W. One of AMD's reasons for implementing Game Mode like this was due to certain games not accepting the number of threads on offer - in the situations above, both of the new modes tested have 16 threads, at which point disabling SMT would appear to be preferable for performance.


104 Comments
View All Comments
WoWFishmonger - Thursday, August 17, 2017 - link
I thought it was "The proof is in the PUDDING"All this time I've been eating pudding, looking for proof..... explains why I haven't found any yet. :|
Nice write up, its good to see that even if people won't use this new mode, they do have the choice to enable it.
Nothing wrong with choice IMO.
Ian Cutress - Thursday, August 17, 2017 - link
Heh, wow. That's a bad typo. Fixed, thanks :)edzieba - Thursday, August 17, 2017 - link
"I thought it was "The proof is in the PUDDING""The phrase is: "the proof of the pudding is in the eating".
boozed - Thursday, August 17, 2017 - link
ThisAlexvrb - Saturday, August 19, 2017 - link
I've always heard "the proof is in the pudding". The shorter version's meaning is still pretty apparent. Plus it rolls off the tongue better, so to speak. Mmmm..... pudding.sprockincat - Thursday, August 17, 2017 - link
While we're on the topic, I think it's "Game Mode as originally envisioned by AMD."NikosD - Thursday, August 17, 2017 - link
So, you read my comment regarding your mistake at the first TR review of assuming a 16C/16T CPU after enabling Game Mode instead of a 8C/16T and you corrected that in your new review.Now, you only have to repeat your tests with DDR4-3200 and select a different, more "workstation" kind of benchmarks in order to test monsters of 32 threads and not PDF opening of course !
Mercy !
Aisalem - Thursday, August 17, 2017 - link
For the average person reading most of tech sites the more workstation benchmarks doesn't really makes sense.What I would like to see if you can enable game mode and disable SMT. That will leave 1950X with 8 cores available to the system which still should be enough for gaming but might present even better results.
Zstream - Thursday, August 17, 2017 - link
For the love of all things... no one buys TR to just play games, or open .PDF's.Gothmoth - Thursday, August 17, 2017 - link
well noobs do.but i think websites like anandtech should know better.. but well anand is gone and.
the new generation is obviously no adequat replacement.