The AMD Ryzen 3 1300X and Ryzen 3 1200 CPU Review: Zen on a Budget
by Ian Cutress on July 27, 2017 9:30 AM EST- Posted in
- CPUs
- AMD
- Zen
- Ryzen
- Ryzen 3
- Ryzen 3 1300X
- Ryzen 3 1200
Benchmarking Performance: CPU Legacy Tests
Our legacy tests represent benchmarks that were once at the height of their time. Some of these are industry standard synthetics, and we have data going back over 10 years. All of the data here has been rerun on Windows 10, and we plan to go back several generations of components to see how performance has evolved.
All of our benchmark results can also be found in our benchmark engine, Bench.
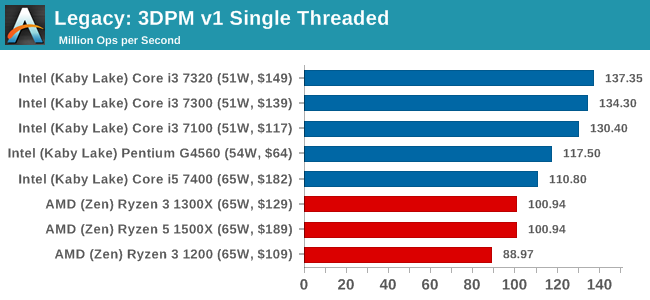
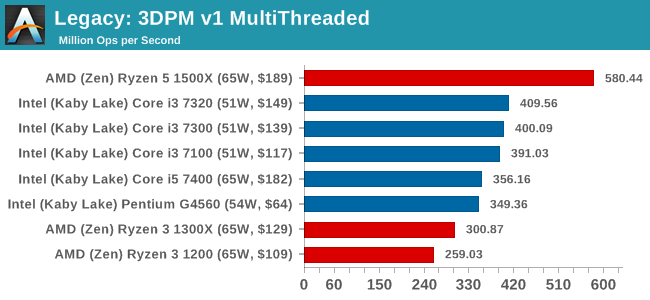
3D Particle Movement v1
3DPM is a self-penned benchmark, taking basic 3D movement algorithms used in Brownian Motion simulations and testing them for speed. High floating point performance, MHz and IPC wins in the single thread version, whereas the multithread version has to handle the threads and loves more cores. This is the original version, written in the style of a typical non-computer science student coding up an algorithm for their theoretical problem, and comes without any non-obvious optimizations not already performed by the compiler, such as false sharing.
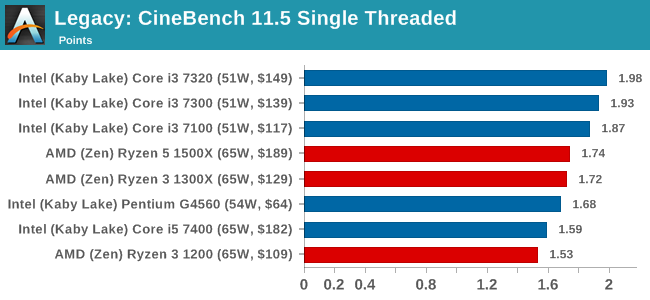
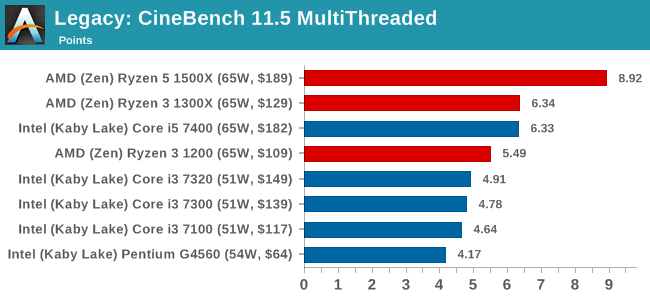
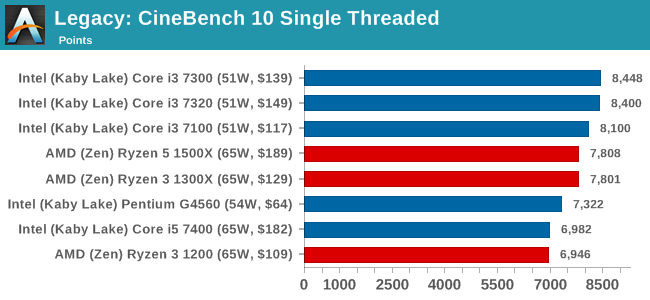
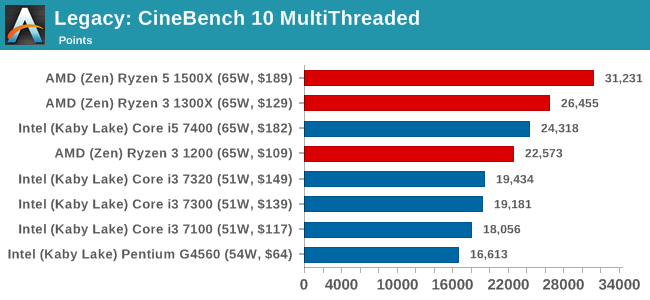
CineBench 11.5 and 10
Cinebench is a widely known benchmarking tool for measuring performance relative to MAXON's animation software Cinema 4D. Cinebench has been optimized over a decade and focuses on purely CPU horsepower, meaning if there is a discrepancy in pure throughput characteristics, Cinebench is likely to show that discrepancy. Arguably other software doesn't make use of all the tools available, so the real world relevance might purely be academic, but given our large database of data for Cinebench it seems difficult to ignore a small five-minute test. We run the modern version 15 in this test, as well as the older 11.5 and 10 due to our back data.
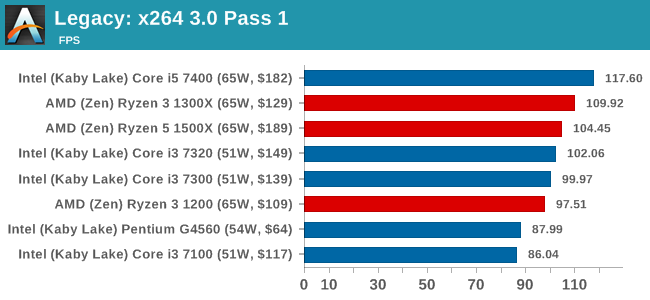
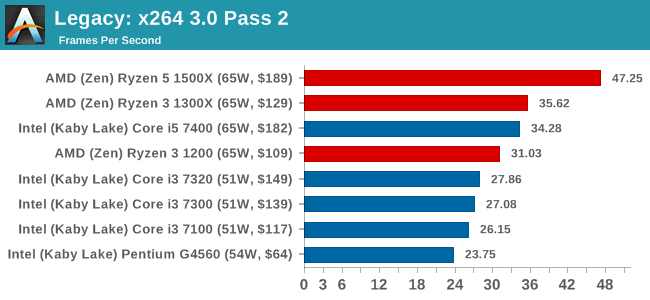
x264 HD 3.0
Similarly, the x264 HD 3.0 package we use here is also kept for historic regressional data. The latest version is 5.0.1, and encodes a 1080p video clip into a high-quality x264 file. Version 3.0 only performs the same test on a 720p file, and in most circumstances the software performance hits its limit on high-end processors, but still works well for mainstream and low-end. Also, this version only takes a few minutes, whereas the latest can take over 90 minutes to run.


140 Comments
View All Comments
HollyDOL - Thursday, July 27, 2017 - link
Ian hasn't failed us. Thorough review on day one. Now to read it whole :-)Ian Cutress - Thursday, July 27, 2017 - link
Results are still coming in for the 1300X, this will take another day or two and I'll add in the graphs but all the Ryzen 3 1200 data is in Bench.Each of the 3 GPUs still to go is about 5 hrs each to test, Chrome Compile and SYSMark is another 10 hr. I've still got results for the 7300 coming in as well on my second test-bed.
srkelley5 - Thursday, July 27, 2017 - link
Thank you! I know that it's more work, but is there any chance of getting charts that compare these results against Vishera cpu's?0ldman79 - Saturday, July 29, 2017 - link
Seconded.It is a shame that we still don't have a direct comparison between AMD's big CPU from last gen vs the current generation.
StevoLincolnite - Saturday, July 29, 2017 - link
Can't compare my Sandy-Bridge-E 3930K either.Or the Phenom 2 x6...
0ldman79 - Wednesday, August 2, 2017 - link
It looks like a lot of the information is already on the bench, just formatted differently.Shame.
Ian Cutress - Sunday, July 30, 2017 - link
I've got a regression testing project ongoing which is taking most of my regular time to get sorted. More details soon.AndrewJacksonZA - Thursday, July 27, 2017 - link
Thanks for your hard work, Ian (and team?) We appreciate it. I must say, I'm impressed with what this 1300X can do - and for only $130 too!Correction on the last graph: the X-axis title says, well, "Title." :-)
ddriver - Thursday, July 27, 2017 - link
You should do relative x scale for the price/performance charts. It will be more informative than absolute scale, besides, how many CPUs under 50$ are there, and how many go as low as 0$?coolhardware - Thursday, July 27, 2017 - link
Agreed, thank you for the review Ian! I've been waiting for a nice Ryzen close to the $100 price point, the 1300X is close enough in price for me and I like what I read in the review.Especially interested to see how performance in my daily work compares to my trusty 2500K and some more modern i7 mobile CPUs.
Excited to pick one of these up! :-)
NewEgg shows 7/31 release:
https://www.newegg.com/Product/Product.aspx?Item=N...
Amazon usually ships faster for me so I plan on ordering from them:
http://amzn.to/2v1fJqh (url shortened)
PS Does MicroCenter usually have CPUs in store on launch day?