The AMD Ryzen 3 1300X and Ryzen 3 1200 CPU Review: Zen on a Budget
by Ian Cutress on July 27, 2017 9:30 AM EST- Posted in
- CPUs
- AMD
- Zen
- Ryzen
- Ryzen 3
- Ryzen 3 1300X
- Ryzen 3 1200
Benchmarking Performance: CPU Rendering Tests
Rendering tests are a long-time favorite of reviewers and benchmarkers, as the code used by rendering packages is usually highly optimized to squeeze every little bit of performance out. Sometimes rendering programs end up being heavily memory dependent as well - when you have that many threads flying about with a ton of data, having low latency memory can be key to everything. Here we take a few of the usual rendering packages under Windows 10, as well as a few new interesting benchmarks.
All of our benchmark results can also be found in our benchmark engine, Bench.
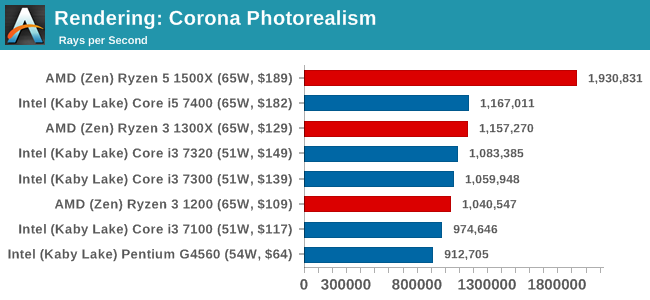
Corona 1.3: link
Corona is a standalone package designed to assist software like 3ds Max and Maya with photorealism via ray tracing. It's simple - shoot rays, get pixels. OK, it's more complicated than that, but the benchmark renders a fixed scene six times and offers results in terms of time and rays per second. The official benchmark tables list user submitted results in terms of time, however I feel rays per second is a better metric (in general, scores where higher is better seem to be easier to explain anyway). Corona likes to pile on the threads, so the results end up being very staggered based on thread count.
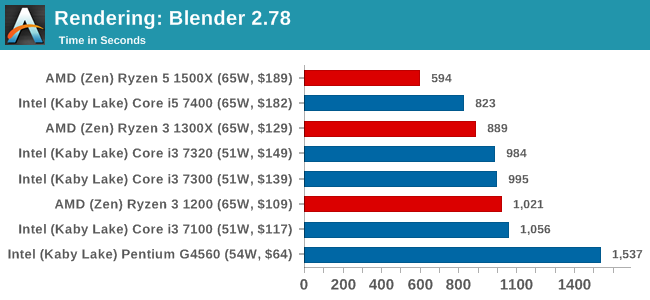
Blender 2.78: link
For a render that has been around for what seems like ages, Blender is still a highly popular tool. We managed to wrap up a standard workload into the February 5 nightly build of Blender and measure the time it takes to render the first frame of the scene. Being one of the bigger open source tools out there, it means both AMD and Intel work actively to help improve the codebase, for better or for worse on their own/each other's microarchitecture.
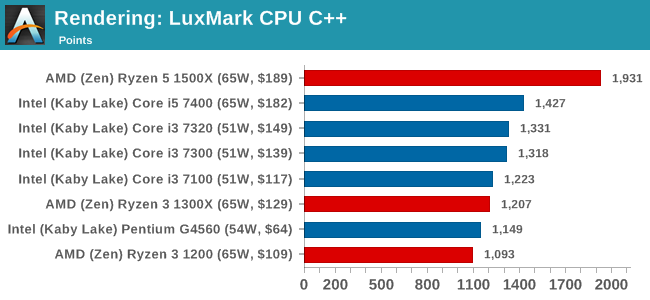
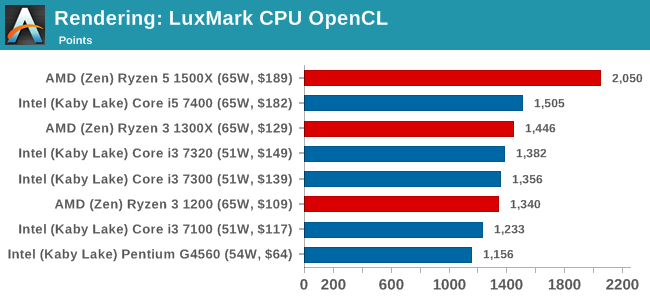
LuxMark v3.1: Link
As a synthetic, LuxMark might come across as somewhat arbitrary as a renderer, given that it's mainly used to test GPUs, but it does offer both an OpenCL and a standard C++ mode. In this instance, aside from seeing the comparison in each coding mode for cores and IPC, we also get to see the difference in performance moving from a C++ based code-stack to an OpenCL one with a CPU as the main host.
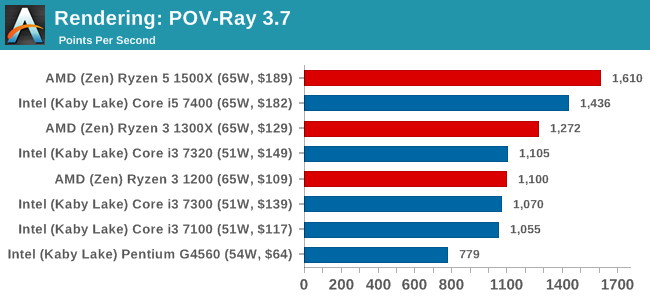
POV-Ray 3.7.1b4: link
Another regular benchmark in most suites, POV-Ray is another ray-tracer but has been around for many years. It just so happens that during the run up to AMD's Ryzen launch, the code base started to get active again with developers making changes to the code and pushing out updates. Our version and benchmarking started just before that was happening, but given time we will see where the POV-Ray code ends up and adjust in due course.
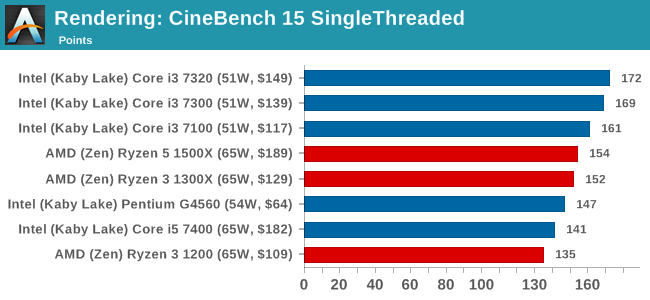
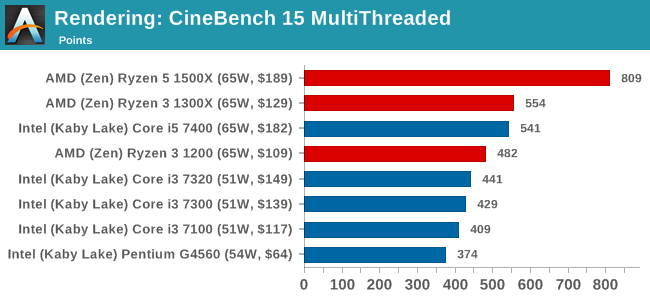
Cinebench R15: link
The latest version of CineBench has also become one of those 'used everywhere' benchmarks, particularly as an indicator of single thread performance. High IPC and high frequency gives performance in ST, whereas having good scaling and many cores is where the MT test wins out.


140 Comments
View All Comments
HollyDOL - Thursday, July 27, 2017 - link
Ian hasn't failed us. Thorough review on day one. Now to read it whole :-)Ian Cutress - Thursday, July 27, 2017 - link
Results are still coming in for the 1300X, this will take another day or two and I'll add in the graphs but all the Ryzen 3 1200 data is in Bench.Each of the 3 GPUs still to go is about 5 hrs each to test, Chrome Compile and SYSMark is another 10 hr. I've still got results for the 7300 coming in as well on my second test-bed.
srkelley5 - Thursday, July 27, 2017 - link
Thank you! I know that it's more work, but is there any chance of getting charts that compare these results against Vishera cpu's?0ldman79 - Saturday, July 29, 2017 - link
Seconded.It is a shame that we still don't have a direct comparison between AMD's big CPU from last gen vs the current generation.
StevoLincolnite - Saturday, July 29, 2017 - link
Can't compare my Sandy-Bridge-E 3930K either.Or the Phenom 2 x6...
0ldman79 - Wednesday, August 2, 2017 - link
It looks like a lot of the information is already on the bench, just formatted differently.Shame.
Ian Cutress - Sunday, July 30, 2017 - link
I've got a regression testing project ongoing which is taking most of my regular time to get sorted. More details soon.AndrewJacksonZA - Thursday, July 27, 2017 - link
Thanks for your hard work, Ian (and team?) We appreciate it. I must say, I'm impressed with what this 1300X can do - and for only $130 too!Correction on the last graph: the X-axis title says, well, "Title." :-)
ddriver - Thursday, July 27, 2017 - link
You should do relative x scale for the price/performance charts. It will be more informative than absolute scale, besides, how many CPUs under 50$ are there, and how many go as low as 0$?coolhardware - Thursday, July 27, 2017 - link
Agreed, thank you for the review Ian! I've been waiting for a nice Ryzen close to the $100 price point, the 1300X is close enough in price for me and I like what I read in the review.Especially interested to see how performance in my daily work compares to my trusty 2500K and some more modern i7 mobile CPUs.
Excited to pick one of these up! :-)
NewEgg shows 7/31 release:
https://www.newegg.com/Product/Product.aspx?Item=N...
Amazon usually ships faster for me so I plan on ordering from them:
http://amzn.to/2v1fJqh (url shortened)
PS Does MicroCenter usually have CPUs in store on launch day?