Zotac ZBOX CI523 nano Fanless Skylake-U mini-PC Review
by Ganesh T S on October 5, 2016 8:00 AM ESTPower Consumption and Thermal Performance
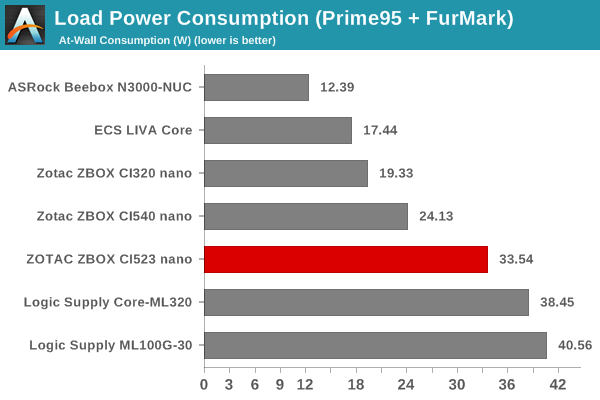
The power consumption at the wall was measured with a 1080p display being driven through the HDMI port. In the graphs below, we compare the idle and load power of the ZOTAC ZBOX CI523 nano with other low power PCs evaluated before. For load power consumption, we ran the AIDA64 System Stability Test with various stress components, as well as our custom Prime95 + Furmark stress test, and noted the maximum sustained power consumption at the wall.
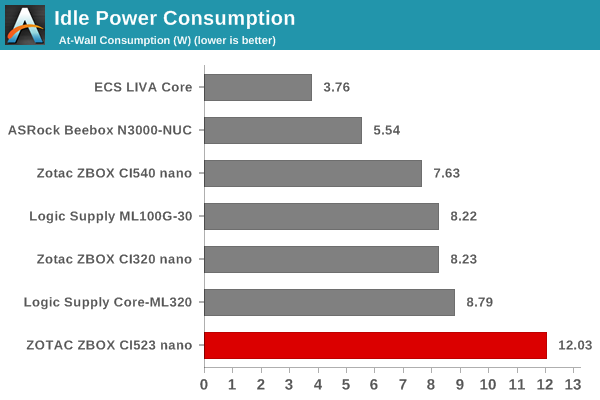
As we saw earlier in the HTPC Credentials section, the CI523 nano configuration being evaluated is not the most power-efficient. Idle power is the worst amongst all considered system, possibly due to BIOS defaults not allowing the system to move into a low-power state. A part of the blame might also lie in our choice of components for the build (high-performance RAM and SSD).
We adopt two different thermal stress testing routines - one involving the AIDA64 System Stability Test (SST), and the other custom one using a combination of Prime95 and Furmark. The AIDA64 SST routine starts with the system at idle, followed by four stages of different system loading profiles (each of 30 minutes duration). In the first stage, we stress the CPU, caches and RAM. In the second stage, we add the GPU to the above list. In the third stage, we stress the GPU standalone. In the final stage, we stress all the system components (including the disks). Beyond this, we leave the unit idle in order to determine how quickly the various temperatures in the system can come back to normal idling range. The second routine (custom stress testing) loads up Prime 95 for 30 minutes, followed by Furmark for 30 minutes. The Prime 95 load is then removed, allowing just the GPU alone to be stressed for 30 minutes. The system is then left idle.
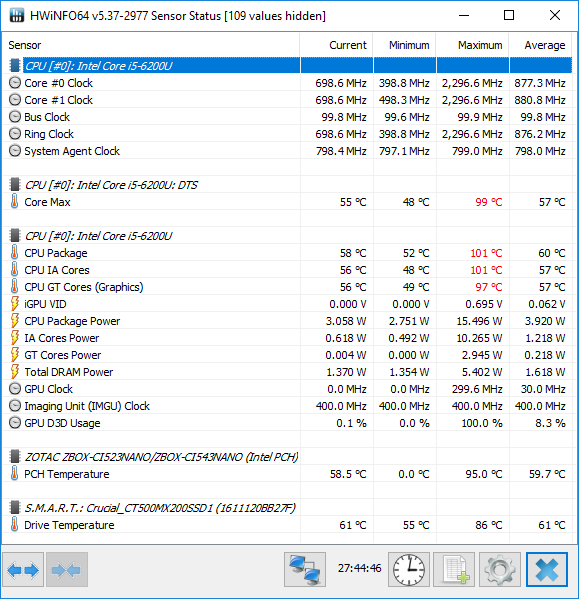
In order to set the stage for a discussion of the thermal stress testing results, a recount of our experience with the review unit out-of-the-box is necessary. The sample shipped with BIOS Version 2K160613 and we did our first round of testing with that BIOS. In the middle of our stress tests, the Wi-Fi connection dropped out and our remote monitoring script couldn't keep track of the various internal parameters. Fortunately, the at-wall power consumption measurement was still active, and HWiNFO had a record of the maximum values of the internal parameters during the course of the stress test. It showed that the CPU package temperature reached as high as 101C, and the unit had thermally throttled.
Zotac ZBOX CI523 nano - Custom Stress Test Results with BIOS Version 2K160613
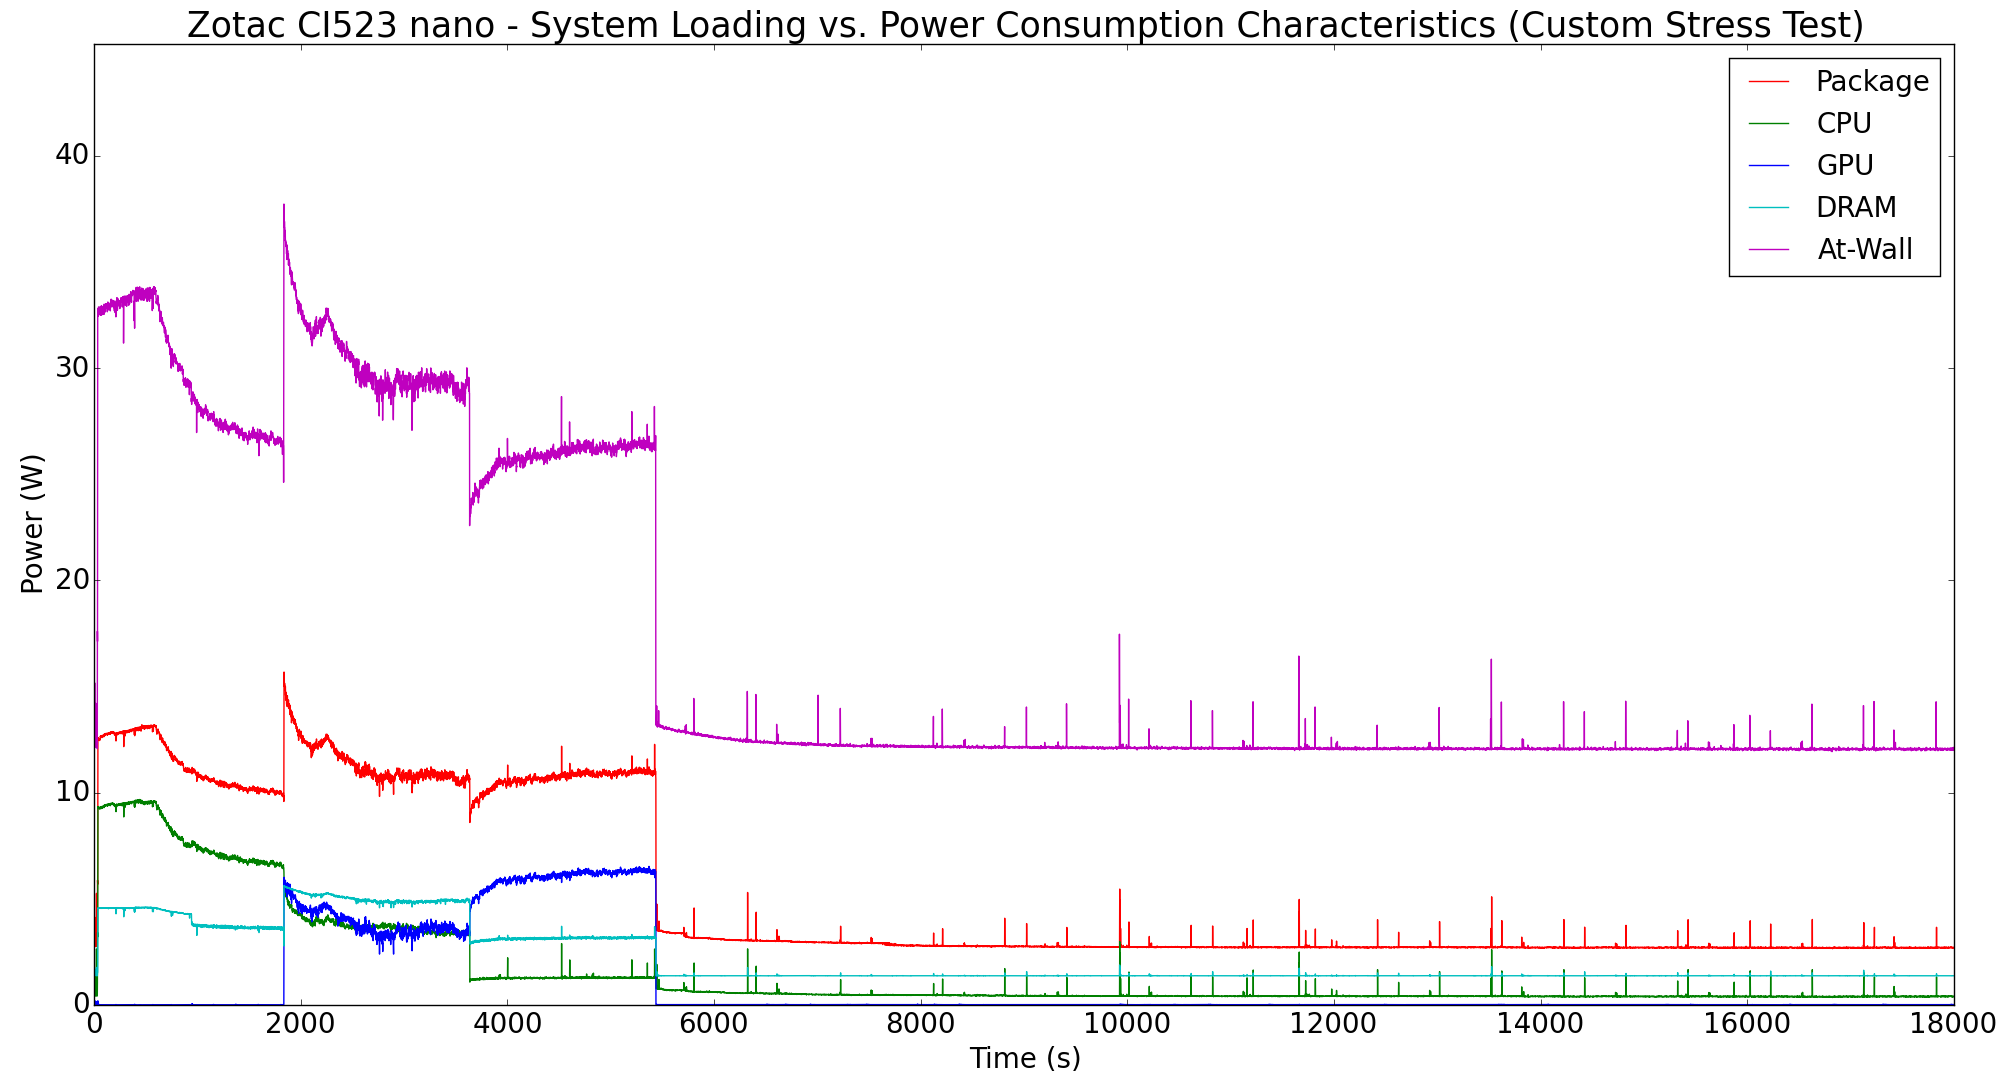
Zotac indicated that the issue had been resolved in a BIOS update, and that our stress testing would pass with BIOS Version 2K160902 (which had changed some thermal parameters). A detailed look at the various parameters during the course of our stress tests with the new BIOS is presented further down, but, we were curious about the implications of the changed thermal parameters. To understand this, we plotted the at-wall power consumption during the course of our custom stress test with the two BIOS versions.
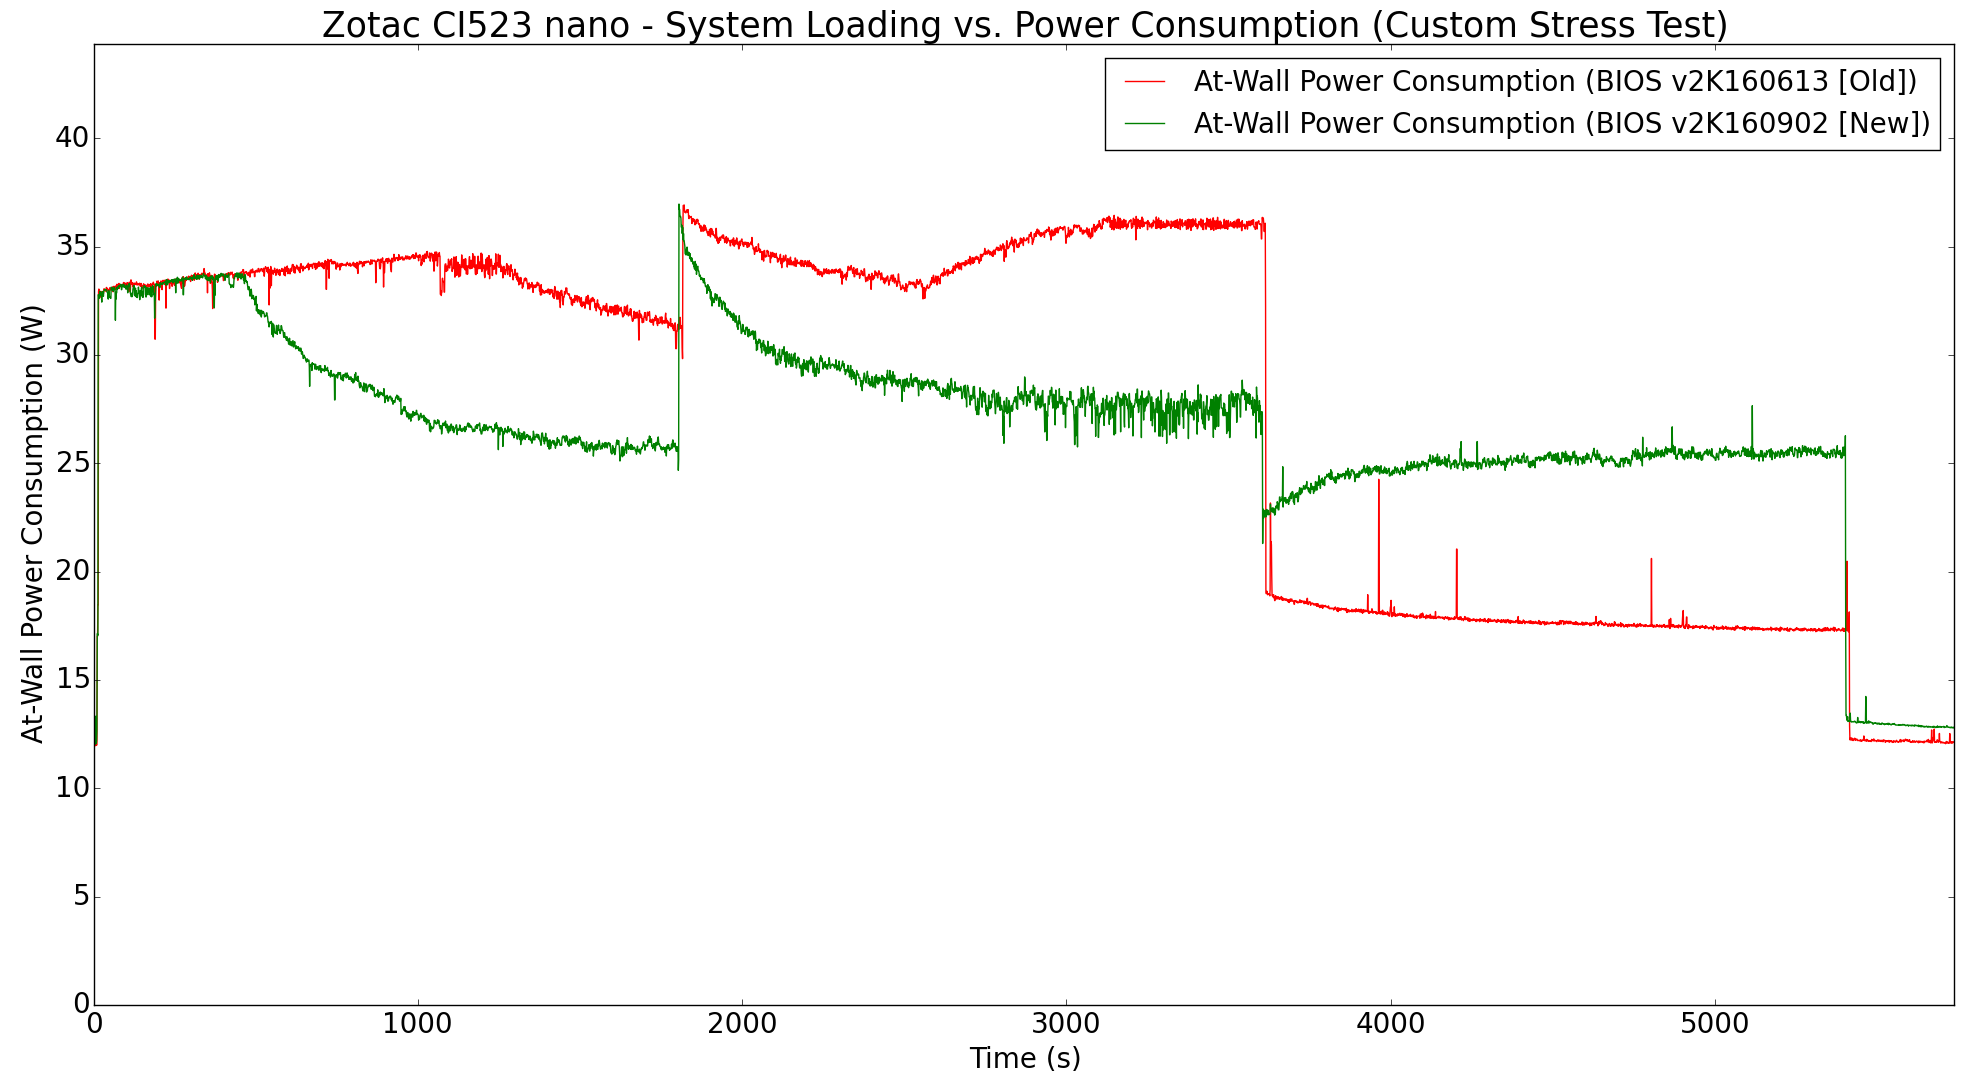
It is clear that the changed thermal parameters has an effect on the performance of the PC under sustained loading conditions. While the old BIOS had the PC sustaining more than 35W at the wall with dangerous package temperatures, the new BIOS can only sustain around 28W under the same conditions. The at-wall power numbers are directly related to the CPU package power, as we will see in the graphs below.
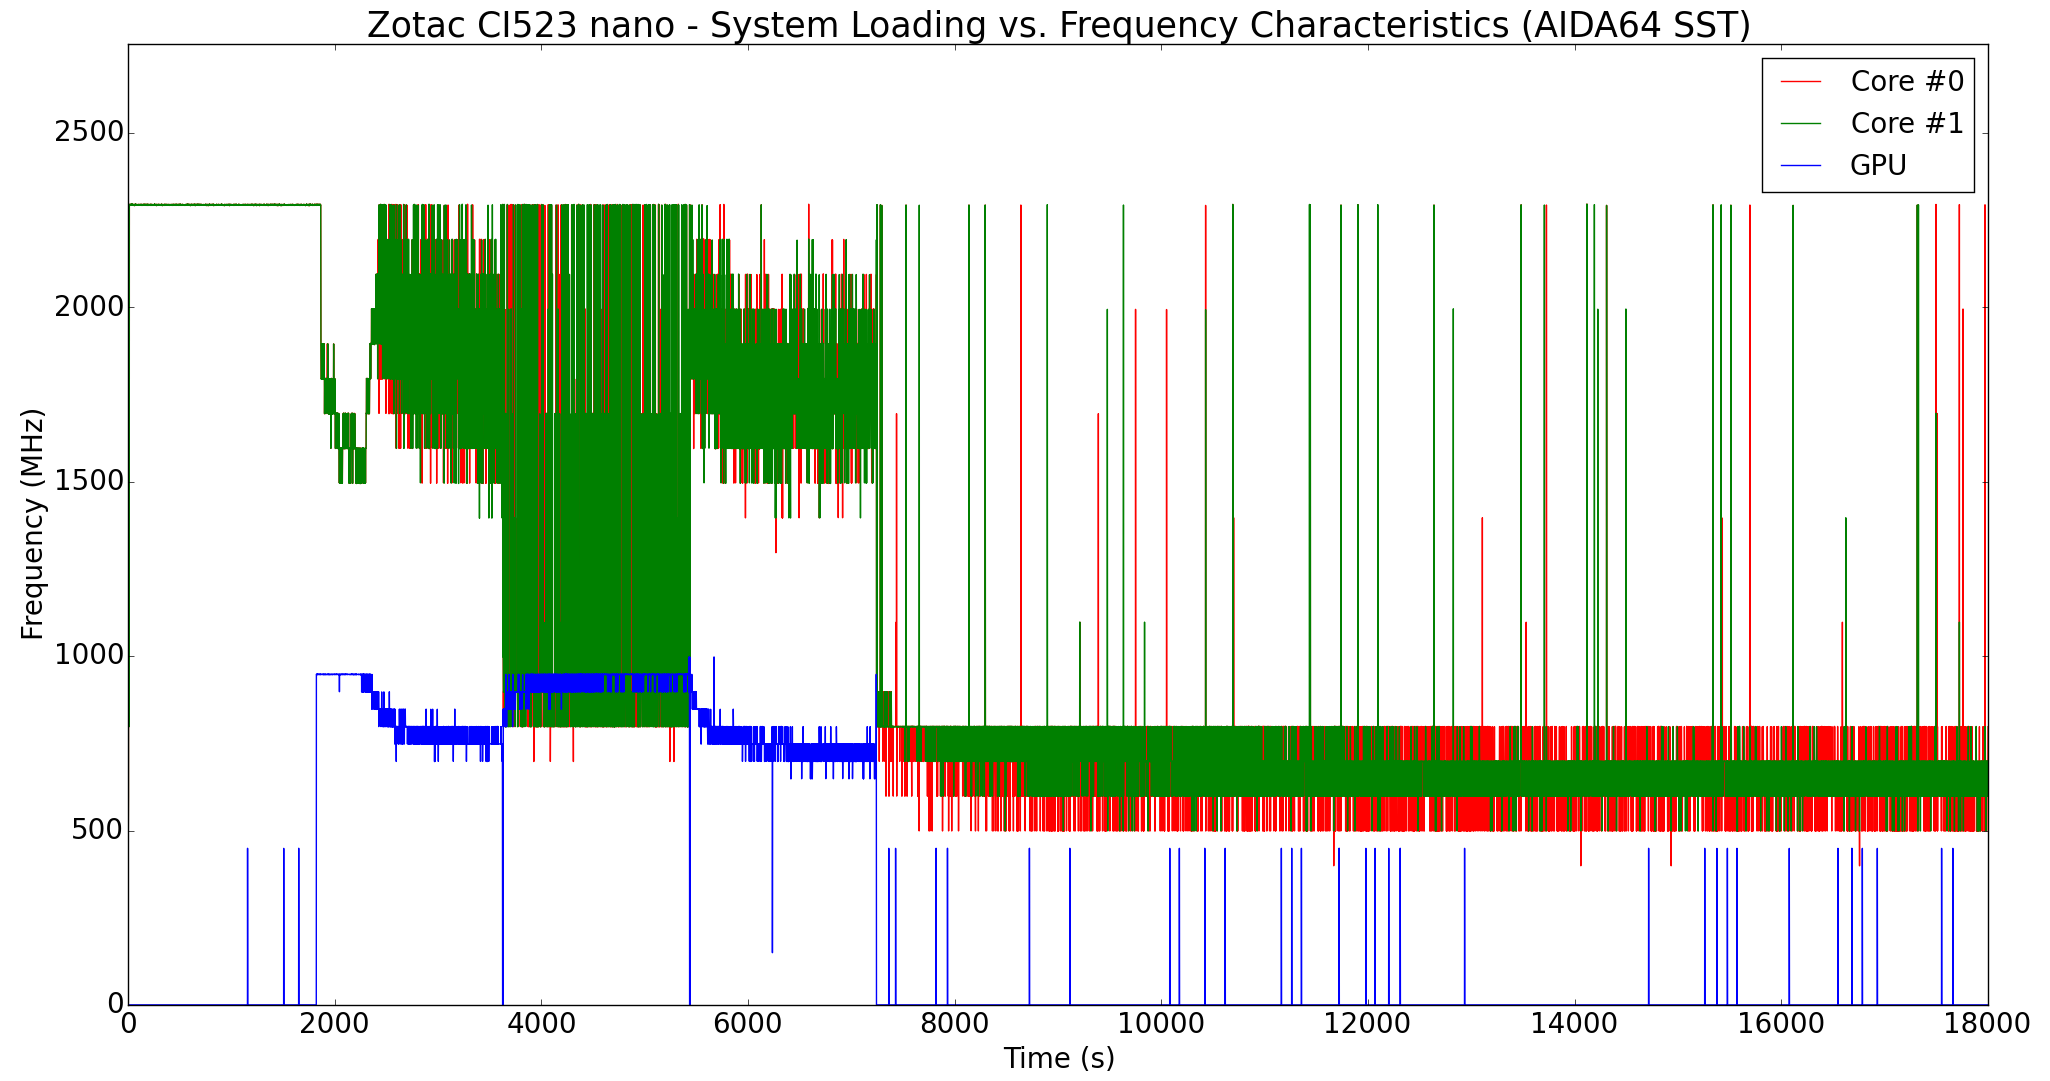
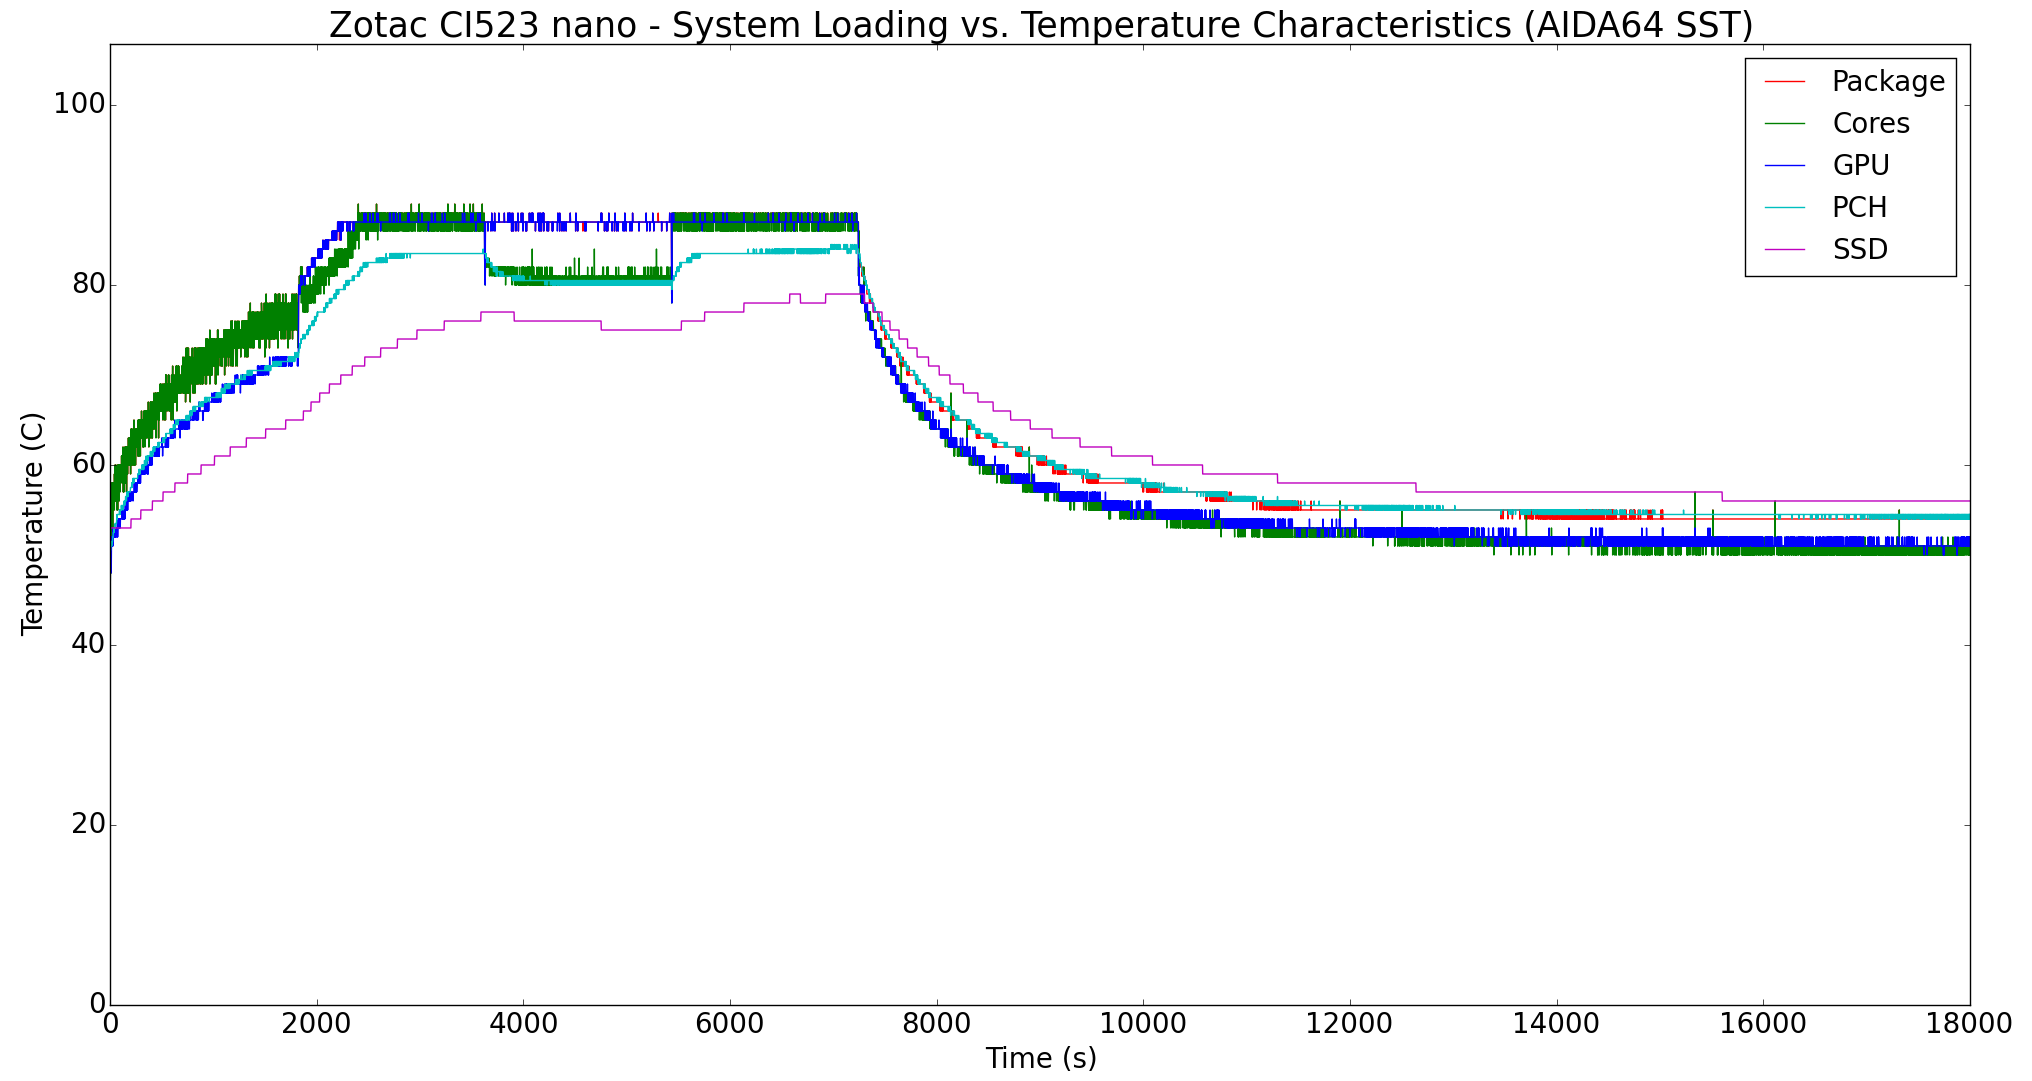
The various clocks, temperatures and power consumption numbers for the system during the AIDA64 SST routine are presented in the graphs below. The cores are able to sustain the maximum 2.3 GHz frequency over the duration of the CPU / RAM stress. Once the GPU comes into play, the cores move to around 1.6 GHz while the GPU pegs away at 900 MHz for sometime before the thermal parameters come into play. When the package temperature reaches 88 C, the GPU clock starts dropping down to around 750 MHz. In the pure GPU stress segment, the cores shift between 800 MHz and 2.6 GHz, while the GPU manages to sustain at the maximum frequency despite its temperature being close to 90 C. However, the cores cool down a little giving the package temperature a little head room. Once the disk stress is added, it is back to throttling both the CPU and GPU clocks while maintaining the package temperature close to 90 C.

The power consumption numbers for various components help in deeper analysis, as the thermal parameters in the new BIOS just ensure that the package power consumption is throttled to keep the unit operating in a safe manner. In the above graph, we can see that the 15W package power consumption can only be sustained for around 10 minutes before it needs to be throttled down to around 12W.
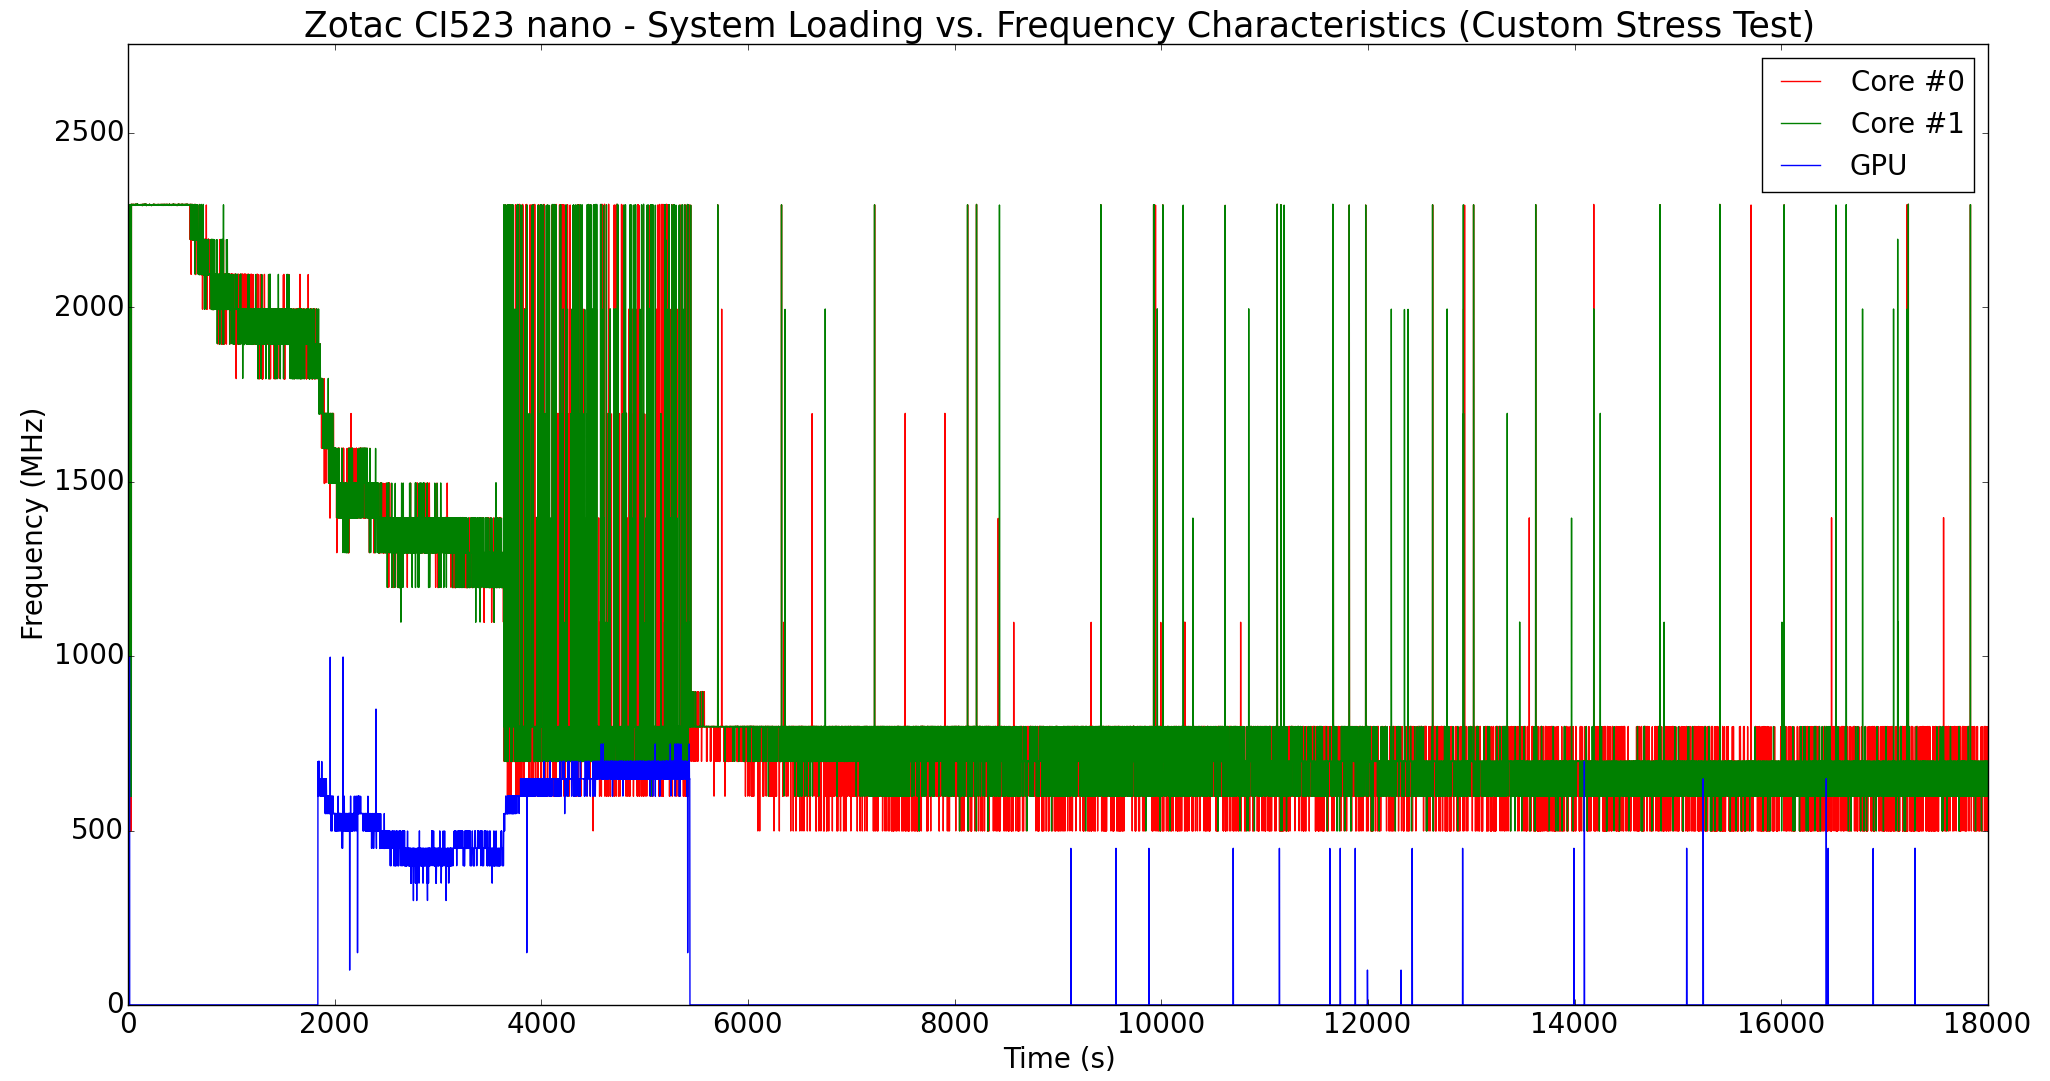
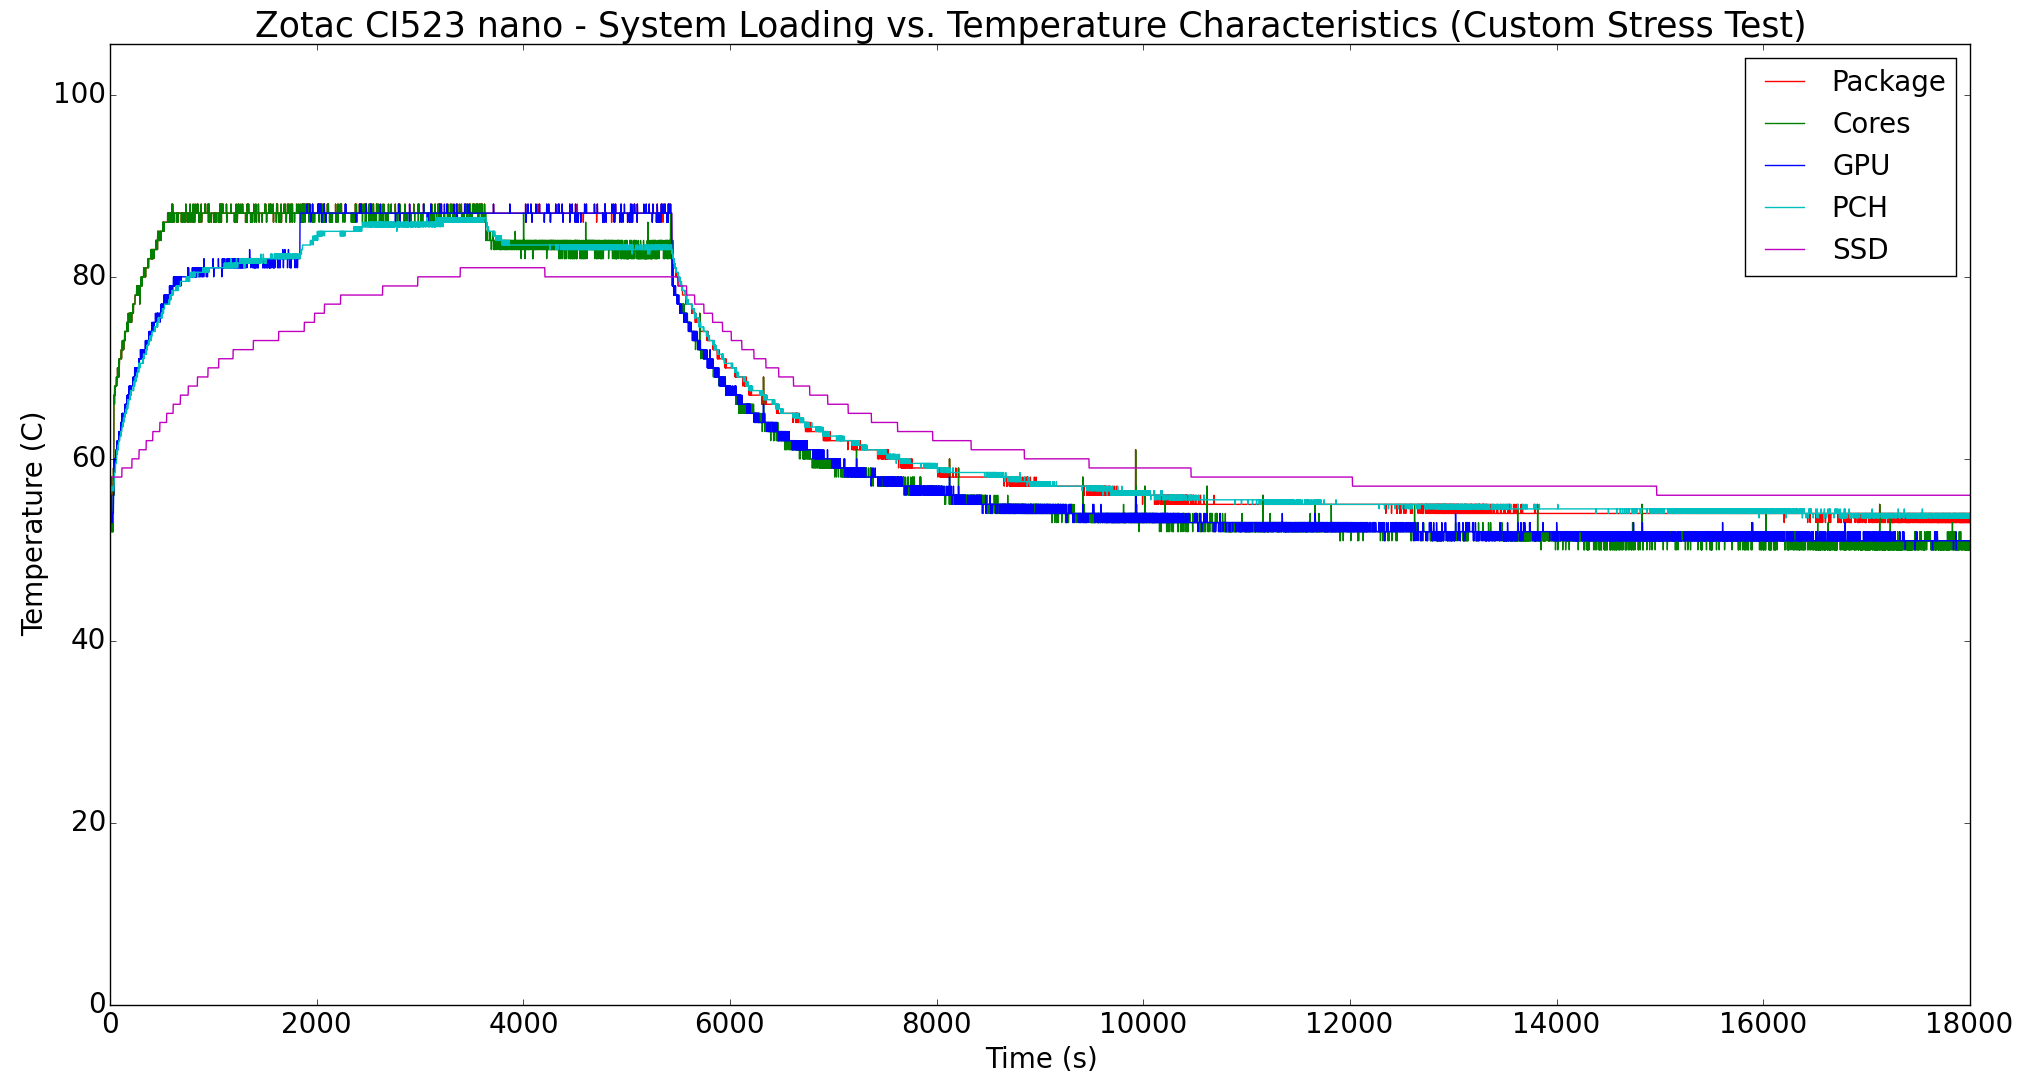
The same set of parameters were also recorded during the course of our custom stress test. Hitting the 90 C thermal parameter is faster in this routine, as it happes around 10 minutes into our CPU stress segment itself. An interesting aspect here is that the GPU stress by Furmark keeps the GPU clocks around 700 MHz, while the AIDA64 SST could keep it at 900 MHz while being within the safe temperature parameters dictated by the BIOS. One of the unfortunate aspects here is that the SSD temperature reaches as high as 80 C even when there is no disk stress routine.
The power consumption numbers also show what we observed in the AIDA64 SST case. The thermal design of the Zotac ZBOX CI523 nano can't sustain a 15W TDP CPU for more than 10 minutes at full load. That said, it seems to be quite effective for a 12W scenario. In any case, the latest BIOS definitely resolves any overheating concerns and the CPU manages to remain below the junction temperature irrespective of the applied stress.
Another important aspect to keep note of while evaluating fanless PCs is the chassis temperature. Using the Android version of the FLIR One thermal imager, we observed the chassis temperature after the CPU package temperature reached the steady state value in the above graph.
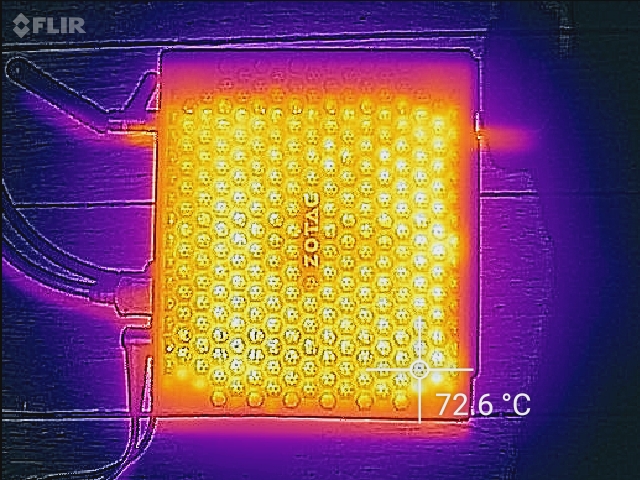
We have additional thermal images in the gallery below.


The images show that certain parts of the chassis can reach temperatures of around 73 C. This is on par with what we have seen in other passively cooled PCs subject to our thermal stress testing routines.


35 Comments
View All Comments
leegroves86 - Wednesday, October 5, 2016 - link
"Processor Intel Core i7-6500U"Eh, maybe that's supposed to read 'Intel Core i3-6100U'
ingwe - Wednesday, October 5, 2016 - link
Wow yeah. That is a big difference. I looked at the price and couldn't believe that it was an i7. Then I kept reading and realized it wasn't an i7.YSJ - Wednesday, October 5, 2016 - link
HWinfo on the Power Consumption page says it's an i5-6200Uganeshts - Wednesday, October 5, 2016 - link
Guys, the i7 mention is a table porting typo from the previous review. It has been fixed. The core count / frequencies / cache size were fixed correctly after the copy-over. Apologies for the typo.The HWiNFO representation is erroneous because Zotac uses the same product ID string for both the CI523 nano and CI543 nano. The latter uses the Core i5, and HWiNFO gets confused because of that.
The AIDA64 report confirming the Core i3-6100U (if it wasn't obvious from the multiple references to it in the text of the review and also the frequencies in the graphs) is here: http://images.anandtech.com/reviews/mini-pcs/AIDA-...
JoeyJoJo123 - Wednesday, October 5, 2016 - link
No dual LAN, no interest. I'd really like Zotac/Gigabyte/Intel to make a SFF NUC-like PC with dual LAN so that I can buy one to be used as a pfSense router. I'd highly prefer not to be stuck with an anemic pentium/celeron chinese off-brand pfSense router...ganeshts - Wednesday, October 5, 2016 - link
Zotac has the fanless CI545 nano for that : https://www.amazon.com/dp/B01GOK0HS4/GIGABYTE has the -L series Skylake BRIX units. We just reviewed one a couple of weeks back: http://www.anandtech.com/show/10689/gigabyte-gbbsi...
JoeyJoJo123 - Wednesday, October 5, 2016 - link
OH! AWESOME!There's even an affordable barebones for less than $150, too, here:
https://www.amazon.com/dp/B0179S50UU/
Thanks, Ganesh!
damianrobertjones - Wednesday, October 5, 2016 - link
Imagine a world where you can buy a USB ethernet adapter! :)ganeshts - Wednesday, October 5, 2016 - link
Latency is an issue with USB Ethernet adapters.In addition, for pfSense and other networking applications, some of the hardware acceleration features / offloads provided by Intel NICs can help provide better overall performance.
USB Ethernet adapters are fine for the average use-case, but, I wouldn't suggest using them for any performance-sensitive scenarios.
Flying Aardvark - Wednesday, October 26, 2016 - link
They still have to be better than Wii U wifi. :/