Content Creation Performance
For "Content Creation" performance we use two benchmarks
- the new Content Creation Winstone 2003 and Internet Content Creation SYSMark
2002. Since SYSMark isn't the best for comparing AMD and Intel CPUs, the focus
here should be on Content Creation Winstone 2003, so we start with a description
of the benchmark from its creators, VeriTest:
Multimedia Content Creation Winstone is a system-level,
application-based benchmark that measures a PC's overall performance when
running top, Windows-based, 32-bit, multimedia content creation applications
on Windows 2000 (SP2 or higher), Windows 98, Windows ME, and Windows XP. Multimedia
Content Creation Winstone 2003 uses the following applications:
Adobe® Photoshop® 7.0
Adobe® Premiere® 6.0
Macromedia® Director 8.5.1
Macromedia® Dreamweaver 4
Microsoft® Windows MediaTM Encoder 7.01.00.3055
Netscape® 6.2.3
NewTek's LightWave® 7.5
Sonic Foundry® Sound Forge® 6.0
Following the lead of real users, Multimedia Content
Creation Winstone 2003 keeps multiple applications open at once and switches
among those applications. Multimedia Content Creation Winstone 2003 is a single
large test that runs the above applications through a series of scripted activities
and returns a single score. Those activities focus on what we call "hot
spots," periods of activity that make your PC really work--the times
where you're likely to see an hourglass or a progress bar
Content
Creation Performance
Content Creation Winstone 2003 |
Intel
Pentium 4 3.06GHz

Intel Pentium 4 3.06GHz HT
Intel Pentium 4 2.80GHz
Intel Pentium 4 2.66GHz
Intel Pentium 4 2.53GHz
Intel Pentium 4 2.50GHz
AMD Athlon XP 2800+ (2.25GHz)
AMD Athlon XP 3000+ (2.167GHz) Barton
Intel Pentium 4 2.40GHz
AMD Athlon XP 2700+ (2.167GHz)
Intel Pentium 4 2.26GHz
AMD Athlon XP 2600+ (2.083GHz)
Intel Pentium 4 2.20GHz
AMD Athlon XP 2400+ (2.00GHz)
Intel Pentium 4 2.0AGHz
AMD Athlon XP 2200+ (1.80GHz)
AMD Athlon XP 2100+ (1.73GHz)
Intel Pentium 4 2.0GHz
Intel Pentium 4 1.8AGHz
AMD Athlon XP 2000+ (1.67GHz)
Intel Pentium 4 1.9GHz
AMD Athlon XP 1900+ (1.60GHz)
Intel Pentium 4 1.8GHz
AMD Athlon XP 1800+ (1.53GHz)
Intel Pentium 4 1.6AGHz
AMD Athlon XP 1700+ (1.47GHz)
Intel Pentium 4 1.7GHz
AMD Athlon XP 1600+ (1.40GHz)
Intel Pentium 4 1.6GHz
AMD Athlon XP 1500+ (1.33GHz)
Intel Pentium 4 1.5GHz
|
|
|
 49.5
49.5
 48.6 48.6
46.8
45.3
43.7
42
 41.6 41.6
 40.9 40.9
40.6
40.4
40.1
39.1
38.1
37.1
35.5
34.3
33.5
33
32.8
32.5
31.8
31.4
30.6
30.5
29.7
29.5
29.2
28.4
27.9
27.3
26.5
|
|
|
0 |
|
10 |
|
20 |
|
30 |
|
40 |
|
50 |
|
59 |
|
|
|
A predominantly multimedia based benchmark, we see that the added
L2 cache doesn't help AMD at all and the old 2800+ manages to outperform the
new Barton based 3000+. In the end, the Pentium 4 comes out on top by a decent
margin.
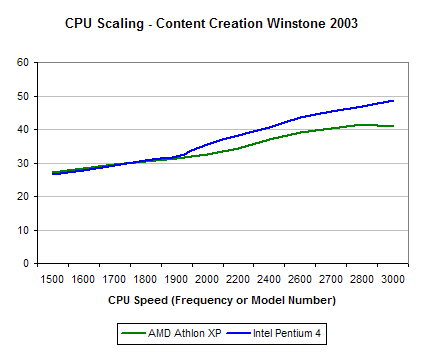
The important thing to take away from this CPU scaling graph is to note how
well the Pentium 4 fared after the move to the Northwood core (look at the 2000
mark on the graph). The performance gap between the Pentium 4 and Athlon XP
seems to be growing in favor of Intel, as is evident by the increasing differential
towards the end of the graph.


1 Comments
View All Comments
Anonymous User - Tuesday, October 21, 2003 - link
Curious? Athlon XP 3000+ (2.167GHz) Barton is running with Intel's P4 2.5 and above and keep up? Intresting