Choosing the Right SSD for a Skylake-U System
by Ganesh T S on May 9, 2016 8:00 AM ESTAnandTech DAS Suite - Power Consumption and Thermal Characteristics
SYSmark 2014 and PCMark 8 provide a high-level view of how the storage device might affect the overall responsiveness of the system. However, when evaluating different SSDs for use in the same system, there are other factors like power consumption and thermal characteristics. In addition, one of the scenarios not considered by either SYSmark 2014 or PCMark 8 is the transfer of large amounts of data (say, a bunch of photos or videos) from a mass storage device to the primary drive in the system. AnandTech's DAS (Direct-Attached Storage) Test Suite covers all these aspects.
The Intel NUC6i5SYK doesn't have a USB 3.1 Gen 2 or Thunderbolt port. Hence, it is difficult, if not, impossible, for an external storage device to keep up with the performance of the PCIe drives inside the system. Therefore, we modified our DAS suite to do the transfer from the primary 120GB partition to the secondary partition of the SSD under test. No RAM drive was set up. The bandwidth and temperature tracking were retained. The test can also reveal whether thermal throttling is triggered due to the transfer of large amounts of data (around 250GB) within a small time window. Before looking at the performance consistency / temperature / bandwidth graphs, let us take a look at the total instantaneous bandwidth numbers for the three different test cases in the DAS test suite.
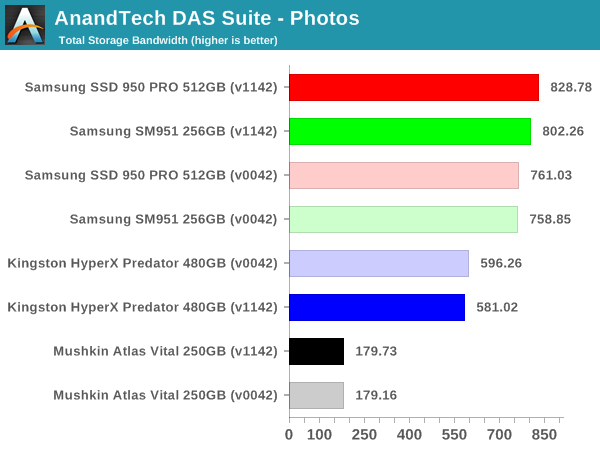
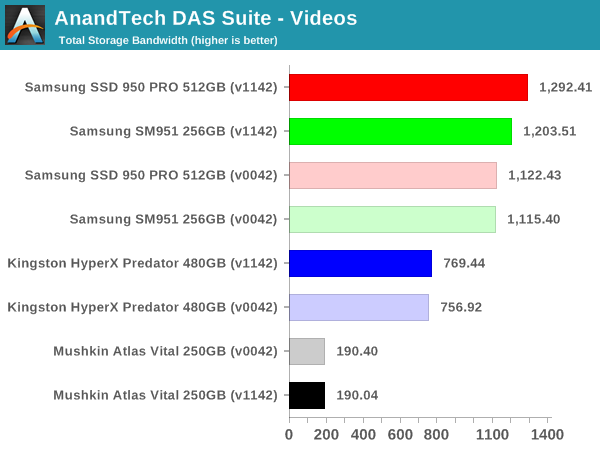
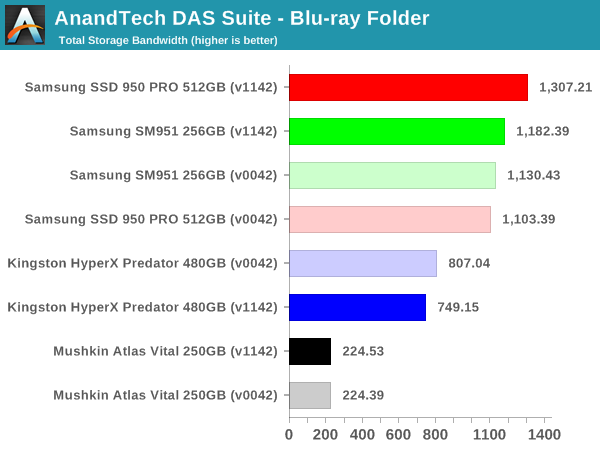
In terms of raw bandwidth and the time taken to finish copying large amounts of data between partitions, the PCIe 3.0 x4 NVMe SSDs obviously win big. However, one must also consider how common this use-case is going to be (given that most external storage devices for Skylake-U systems are not going to keep up with PCIe 2.0 x4 AHCI drives, let alone going to PCIe 3.0 x4 NVMe drives).
The graphs below show the temperature and instantaneous bandwidth numbers for different SSDs with the two BIOS versions. Below that, we also have the power consumed at the wall by the NUC while processing the test suite.
| AnandTech DAS Suite Instantaneous Bandwidth, Thermal Characteristics and At-Wall Power Consumption |
|||
| Mushkin Atlas Vital 250GB MKNSSDAV250GB D8 | Samsung SM951 256GB MZVPV256 | Samsung SSD 950 PRO 512GB | Kingston HyperX Predator 480GB SHPM2280P2H 480G |
-Performance-Consistency.png) |
|||
-Power.png) |
|||
| Mushkin Atlas Vital 250GB MKNSSDAV250GB D8 | Samsung SM951 256GB MZVPV256 | Samsung SSD 950 PRO 512GB | Kingston HyperX Predator 480GB SHPM2280P2H 480G |
The interesting graph to note here is that of the Kingston HyperX Predator SSD. Within a short time after the benchmarking script completes, the drive starts doing power-intensive data shuffling using the huge 1GB DRAM cache on the SSD. We did confirm that the consistently high power draw during the process was not related to any CPU activity. It can also be seen that this background activity in the HyperX Predator is dependent on a number of factors, and the behavior is not always consistent (with the older BIOS, the activity took place without any breaks, but, with the newer BIOS, there were two regions of idling inbetween).
| Intel NUC6i5SYK - Idle Power Consumption | ||||
| Samsung SM951 | Samsung SSD 950 PRO | Kingston HyperX Predator | Mushkin Atlas Vital | |
| OPI GT2 (BIOS v0042) |
7.86 W | 8.46 W | 10.77 W | 7.62 W |
| OPI GT4 (BIOS v1142) |
8.18 W | 10.15 W | 10.78 W | 8.25 W |
Coming back to the quantitative aspects, the tables on either side show the power numbers for the two different link rates (they are slightly different from the numbers in the graphs above, because they only consider the time taken for the test suite to complete, and don't take into account the eventual data shifting done by the controller during idle periods). It can be seen that OPI GT2 is a little bit more power efficient compared to OPI GT4 for the same hardware configuration. The load numbers are a bit different, though, with there being no clear winner across all tested SSDs.
| Intel NUC6i5SYK - Load Power Consumption (AnandTech DAS Suite) | ||||
| Samsung SM951 | Samsung SSD 950 PRO | Kingston HyperX Predator | Mushkin Atlas Vital | |
| OPI GT2 (BIOS v0042) |
22.49 W | 22.49 W | 20.06 W | 17.53 W |
| OPI GT4 (BIOS v1142) |
22.09 W | 22.14 W | 21.24 W | 16.08 W |
The Mushkin Atlas Vital is the most power efficient of the lot (both at load and idle). Even though the Mushkin SSD consumes a lot more energy for the tested task compared to the other SSDs, its idle power is also the lowest. For a desktop running 24x7, it is bound to come out as the better choice for users building a low power computer. The Kingston SSD idles a bit higher compared to the Samsung SSDs, but the load power is lower thanks to the lower transfer rates sustained by former. The number of flash packages and the presence of DRAM in the SSD also influences the power consumption numbers in the above tables. Temperature-wise, all the SSDs ended up between 56 and 59C after the test suite finished processing.


40 Comments
View All Comments
sorcio46 - Monday, May 9, 2016 - link
Is there a reason why these flash SSDs have a lower 4K read speed compared with 4K write?James5mith - Monday, May 9, 2016 - link
My guess is writes are buffered vs. reads straight from the raw NAND. But I have no idea if it's actually true.hojnikb - Monday, May 9, 2016 - link
More or less this.rossjudson - Thursday, May 12, 2016 - link
Flash drives use variations on log-structured storage. The basic thing going on is that the *logical* block numbers being written (which are random) are not the same as the *physical* blocks being written. Drives create 0-N append points, and all those random writes end up becoming sequential writes to pages. At the high end, your write rate can get limited by the page erase rate, which basically translates to an energy/thermal issue (it takes a fair bit of power to erase flash memory pages). The best high end drives can sustain very high mixed read/write rates -- and the key is "sustain" -- for hours/days. Lots of drives out there can handle a short burst of activity for a few tens of seconds, caching everything in RAM on the hardware until the RAM runs out.Random reads are tougher, because you actually have to go to a random storage block and pull the data. Sequential reads admit lookahead, but random reads don't.
Kristian Vättö - Monday, May 9, 2016 - link
Small writes are cached to DRAM for write combining i.e. multiple IOs are written to NAND at once as the IOs are smaller than the page size. Once the IOs hit the DRAM cache, they are considered complete, hence the higher speed.dzezik - Thursday, May 12, 2016 - link
SF-2281 has no DRAM. this is not a DRAM cache. the old SandForce 2281 was designed for SLC. the performance with MLC is medicorebug77 - Monday, May 9, 2016 - link
And I'm going to make this point again: if even when using NVMe, your random reads are still limited at ~50MB/s, you're only missing on sequential transfers if you stick with AHCI and SATA. Because right now, the bottleneck is elsewhere.Also, for Skylake-U (mobile), SATA offers lower standby power.
Kristian Vättö - Monday, May 9, 2016 - link
50MB/s is a ~50% upgrade over ~30MB/s that SATA offers. It's not even close to what HDD to SSD offers, of course, but we will have to wait for next generation memory for the next huge upgrade.bug77 - Monday, May 9, 2016 - link
SATA can do better than ~30MB/s (not sure whether Skylake-U limits the performance in any way, however).NVMe/PCIe still makes sense, because the price premium is not that large. But I'd like to see more reviews highlighting that if you need to save ~$20, going AHCI/SATA is a better option than getting a smaller drive.
vladx - Monday, May 9, 2016 - link
Price premium is not large? LMAO it's almost double over SATA ones.