The Corsair SP (Static Pressure), AF (High Airflow) 120/140mm Fan Review
by E. Fylladitakis on November 25, 2015 8:00 AM ESTFan Testing Methodology
For our first fan review we want to talk about the performance of fans and discuss how we will be testing them in our upcoming articles. This will serve as both a reference point for readers and manufacturers, as well as a chance to receive feedback and input on what we're doing before our first roundups start coming out. A large percentage of computer users are unconcerned with the actual performance of any given fan; most base their choices on recommendations and are swayed by marketing claims of "noiseless operation" and "astounding performance". Advanced users and enthusiasts are using up a lot of grey matter on the topic, seeking to find the best possible solution over dozens of possible choices. Regrettably, even if the user possesses the will and the knowledge to select a product suitable for his/her needs, they are often limited to the manufacturer's specifications, which usually are vague at best.
The fan manufacturers typically provide only a few performance figures, such as the static pressure and maximum volume flow ratings of a fan. However, even if these figures are 100% accurate (and they frequently are not), they are entirely useless to the end consumer. There are many who believe that a high static pressure rating is good for coolers and a high volume flow rating is good for case fans, but this is far from accurate. Maximum static pressure is taken at zero volume flow and maximum volume flow means zero static pressure; either scenario is impossible under real-world conditions. Furthermore, the maximum volume flow is usually calculated from the maximum velocity recorded at the exit of the fan. This is also entirely unrealistic as the fluid flow will definitely not be even across the entire exit area of the fan. The result is that retail products tend to have actual volume flows significantly lower than their specified maximum CFM ratings.
To measure the actual performance of a fan, the user has to know the P-Q (pressure to volume) chart of the fan. Here we measure the amount of applied pressure restriction, measured in mmH2O (where 1 mm H2O is the equivalent of 9.81 Pascals - one Pascal is the pressure required to accelerate 1 kg of mass at a speed of 1 meters per second squared per square meter) required to give a specific volume flow (measured in cubic feet per minute or CFM). The more the flow is restricted, the less volume flow is generated and the higher the pressure of the fan is. Still, some of the computer users who actually know how to interpret a P-Q chart are frequently misconceived that a P-Q chart is depicted by a straight line, such as this:
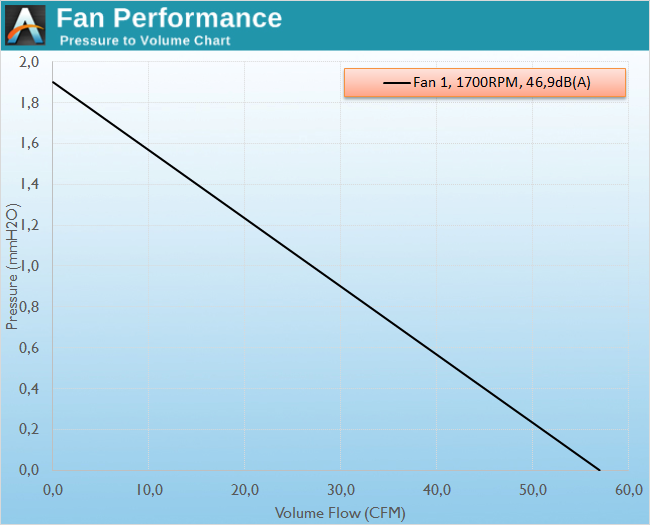
This is the misconception about pressure to volume - reality is a non-linear response
Unfortunately, this could not be further from the truth. The shape of the curve varies between the maximum static pressure and maximum volume flow rating, depending on several dozens of factors, mainly having to do with the design of the blades and the torque (the pushing power) of the engine. As such, two near-identical fans can have completely different behavior, which can be muddied by the actual 'naming' of the fan as an added element of confusion.
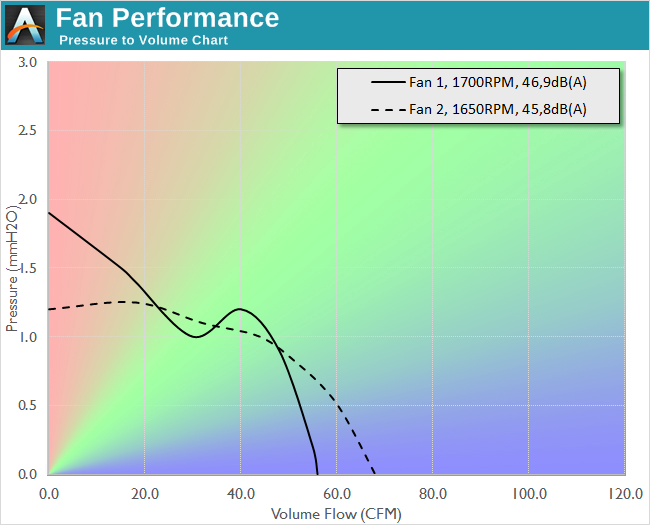
For example, the following chart depicts the P-Q chart of two fans. The first fan has a higher static pressure rating than the second and they both have an equal maximum volume flow (on paper), yet the second fan is a better selection for use as a case fan as it performs better when there are few obstructions.

Fan 2 is preferred in low impedance scenarios (low mmH2O)
as it gives higher airflow (>60 CFM under 0.6 mmH2O)
Unfortunately, the calculation of the impedance (resistance to move air) the fan will face by a grill/cooler/radiator/filter can be very difficult to assess without specialized equipment. It can be measured but it depends on far too many variables, including several environmental figures, such as the temperature and the air density. Even if we did extract a specific graph for every single part, the actual graph would be different for every single user. Therefore, it is not practical to give a graph depicting the exact impedance that an item has. It is however possible to provide an usable estimate, which we will be doing so in our future cooler and radiator reviews. The impedance of different items that can restrict the airflow looks like this:
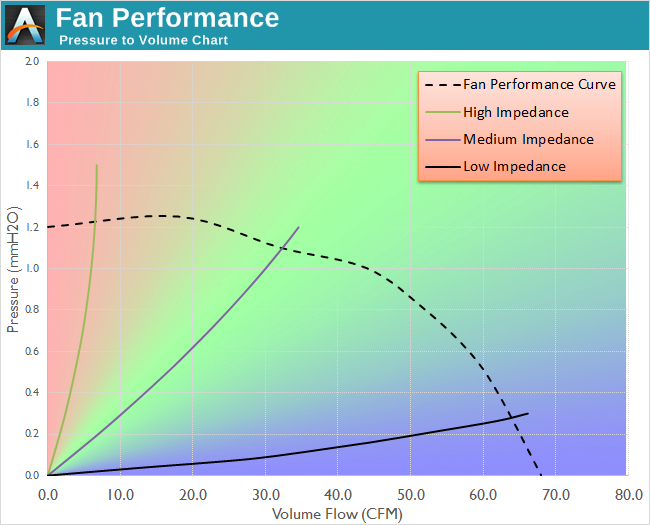
Where the impedance line intersects with the fan's performance curve, that's where the fan will operate.
So a low impedance item generates 0.3 mm H2O of pressure and hits the fan curve at ~63 CFM in this case.
The green line depicts a high impedance item, such as a very dense liquid cooling radiator. The purple line is for a medium impedance item, such as a cooler. The black line is for a low impedance application, such as a case fan with a simple finger guard or a clean filter. For example, the medium impedance item in the graph above would have the fan moving about 32 CFM. There are no actual conditions under which the actual performance of a fan will go very near its maximum static pressure point nor will a fan will reach its maximum volume flow. This allows us to provide a usable estimate when testing coolers, radiators and similar devices. For example, a "very high impedance" radiator would lean towards the left side of the red area, while a "medium to low impendance" cooler would lean towards the right side of the green area.
Where the impedance line intersects with the fan's performance curve, that is the aiflow impedance pressure drop, or by how much of a pressure drop the device (cooler, radiator, filter, etc.) will cause to a fan. Note that the impedance line is highly unlikely to intersect at the same airflow impedance pressure drop point for different fan performance curves. As such, the pressure drop is not something that can be universally assessed for each application but depends on the fan itself as well.
We will be using the above style of graph for the delivery of our results, maintaining the same axes for 120mm/140mm fans for easy comparisons. The red, green and blue areas should be consulted for high, medium and low impedance applications respectively. Even if the axes do shorten, note that the areas remain nearly identical if the range of both axes is reduced by the same percentage.
When the expected obstruction is high, some manufacturers use two fans in series (a push-pull configuration). This is often the case with liquid-cooling radiators. When two fans are placed in series, their pressure at a given airflow is increased (but not doubled) and thus the airflow at a given pressure point is increased, as seen in the following example.
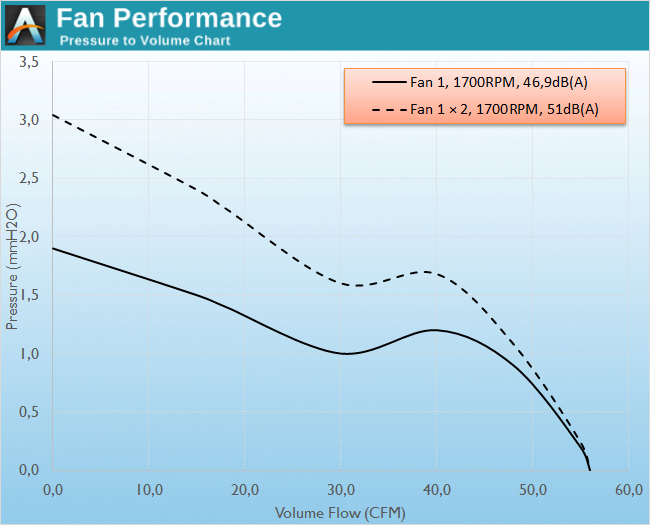
Using two fans in a push/pull configuration.
Thus at a static pressure of 1.5 mmH2O (medium impedance device, such as an air cooler), volume flow increases here from 15 CFM to 43 CFM. However, their maximum airflow will always be the same; therefore, this approach makes no sense when the impedance is low and only in high static pressure situations.
How AnandTech Will Test Fans
We will begin testing fans using an Extech HD350 differential manometer with a Pitot tube, an Extech AN200 velocity meter, and a custom apparatus designed for this specific purpose. The apparatus has a mechanism that allows us to test the unobstructed (maximum) volume flow of a fan, the fully obstructed (maximum static) pressure of the fan, and multiple points in between, allowing us to compose the actual P-Q performance chart of any fan. However, we are measuring the actual airflow generated by the fan, not that calculated by our maximum recorded air velocity.
For noise measurements, we are using an Extech HD600 high sensitivity SPL meter. The noise of the fan is measured from 15 centimeters away, not one meter as IEC certifications require, as that would be far too great a distance to measure differences between nearly silent products. Note however that we are measuring the noise level of a fan with its flow unobstructed. The addition of far grills, the installation on a cooler, and any other form of obstruction will increase the generated noise, as aerodynamic noise will be added into the environment.
We also plan on testing fans at their "stock" 12 V PC voltage and at a lower voltage, which will most usually be 7 V. This may not always be practical on some fans (i.e. very low speed fans may have their performance degraded far too much), but when it is we will do so. While it's impossible to state how any fan will perform in every situation, we will be able to provide at least a more rigorous view of each fan's performance. In the meantime, any feedback on our approach to testing or requests for additional tests is welcome.


92 Comments
View All Comments
E.Fyll - Wednesday, November 25, 2015 - link
The word impedance is by no means limited to electrical resistance. Actually, electrical resistance and electrical impedance are different things to begin with.I can only assume that you are a new student if you have never heard of mechanical impedance. You definitely need to read more about it.
https://en.wikipedia.org/wiki/Mechanical_impedance
The resistance of a system to airflow is called impedance. Drag is the force that opposes airflow, generated by this impedance.
https://www.google.gr/url?sa=t&rct=j&q=&am...
Hulk - Wednesday, November 25, 2015 - link
Interesting. I have a BS in Mechanical Engineering from Rutgers and never heard the term impedance used to describe resistance to fluid flow. Not even in Fluid Mechanics where we spent about 5 weeks deriving the Navier-Stokes equations, which as you know completely describe all fluid behavior. Of course there isn't a closed form solution to these equations so complicated (real life) situations much be modeled via numerical computation.I have a feeling mechanical impedance is an older term that is rarely used anymore.
I think a much more descriptive term for this article would be to use the term "head" to quantify and describe the resistance to airflow through various computer systems as it relates to cooling. ie maintaining a certain rate of airflow though a case with a filter would have greater resistance (head) than one without a filter and thus require a different pump curve. Sizing pumps, which is what we are really talking about here is all about matching pump curves.
http://www.pricepump.com/pumpschool/psles2.html
But I think what most of us really want to know here is how much air a certain fan can move in a high head (resistance) situation and how much noise is makes, as well as in relatively low head situations. I think perhaps testing through a case with no filter would be a low head situation and though a filter would be a high head case. Perhaps testing though a relatively constrictive radiator would also be useful unless results were similar to the filter case. But once tested we'd know if both tests would be useful in the future.
Anyway, how much air flow (cooling)? How quiet? How long will it last? That's the bottom line.
Hulk - Wednesday, November 25, 2015 - link
Also I think most readers would better understand the term "head" for fluid resistance because it can be quantified as the height of a certain air column. ie pushing air case "x" with a filter is akin to pumping air an air column of "y" height, whereas removing the filter reduces the head (air column) height by z.E.Fyll - Wednesday, November 25, 2015 - link
Well, I can only assume that it depends on the school or the professor. Mechanical impedance is a very widely used term. You could run a Google Scholar search and you'd find thousands of papers published only this year.I think that I mentioned that already, but resistance and impedance are different figures. Resistance includes only Real parts. Impedance accounts for the Reactive parts as well.
Head is not resistance. Head is a measure of performance that is based on pressure. Practically, it can be converted from the left axis directly. Head = Pressure/404.3 for air, where head is in ft and pressure is in mmH20. It should generate a similar graph with a different Y axis.
Hulk - Wednesday, November 25, 2015 - link
Head is a measure of performance based on pressure and performance is exactly what you are trying to determine here. That's why I said head may be a better parameter rather than impedance. If you've worked in industry you've probably noticed no one (at least on the US East coast when it comes to pipelines or flow) talks about impedance but rather refer to "head loss." It's a working term, not a school/theory term.Oxford Guy - Thursday, November 26, 2015 - link
"It's a working term, not a school/theory term." That doesn't make it better. It just makes it common.Cold Fussion - Thursday, November 26, 2015 - link
I too have mechanical engineering degree and have never seen the term impedance used like how you use it in the fan curve graphs. Whenever I hear impedance used in a fluids context, it's normally electrical people trying to explain the resistance of a flow due to pressure. In the text books I've studied, what you describe as impedance in the curves is what would have normally described as the system curve or the system head or something along those lines.On a side note I find it pretty ridiculous that you guys have to actually do testing in order to get the fan curves instead of manufacturers providing a datasheet that has the fan curves on it (like they should be doing). I guess that shows the state of PC industry. I appreciate you guys doing real fan testing though and providing this data.
Erazor51 - Thursday, November 26, 2015 - link
E=mc2Freaky_Angelus - Friday, November 27, 2015 - link
LoL, let's throw titles as arguments...I've heard of impedance being used in fluid dynamics and, like the used mmH2O instead of Pascal, it's an older term used mainly by the 'old guard'. I would however recommend Anandtech to next time use Pa. as a term as you'll not find high tech fan-curve sheets using mmH2O (anymore).
On a side-note, if fan reviews are going to be used.. I would like to suggest a push-pull efficiency review on liquid coolers.
In the industry we almost always use pull configurations through heat exchangers as underpressure draws more evenly through an exchanger than otherwise possible with the momentum of the air. I don't have enough liquid coolers systems to be able to make a review, but my own pc is a degree lower. Considering some people might like to know these kind of things and I enjoyed to read something this close to my actual work, who knows.
Ohw, and just for bs argumentation and to be part of this thread: MSc.
mctylr - Wednesday, December 23, 2015 - link
I want to echo [Freaky Angelus]'s comments; mmH2O (millimeter of water) is a dated unit of measurement that isn't the preferred unit in any context as far as I know. It was essentially a metrication variation of inches of Mercury (inHg) that should be left to the history books. Pascals (Pa) would be the unit used for scientific literature in US and abroad. I'm not familiar with US engineering / commercial preferences for fluid dynamics and air flow/fan measurement to be sure, but I suspect they would prefer Pascals over mmH2O as well.