The Huawei Mate S Review
by Andrei Frumusanu on December 2, 2015 8:00 AM EST- Posted in
- Smartphones
- Huawei
- Mobile
- Kirin
- Mate S
Display Measurement
A big part of the story behind the Mate S is the inclusion for the first time Samsung AMOLED screen instead of an traditional LCD panel. Screen quality was in my experience one of the weak-points of Huawei devices. Both the Honor 6 and Mate 7 I reviewed suffered from quite disappointing viewing angles and the P8 review sample I received added in bad backlight bleed into the list of faults with the screens.
The Mate S is a large departure of Huawei devices of the past as the inclusion of the new AMOLED screen basically eliminates viewing angle issues as well as build quality issues leading to uneven backlight illumination. Huawei also uses a Samsung display driver IC (DDIC) that uses panel-self-refresh, a must in any of today's smartphones.
We start by measuring the maxium brightness of the Mate S. As always, our display testing is done with an X-Rite i1Pro 2 spectrophotometer as our measurement hardware, in conjunction with SpectraCal's CalMAN software suite and our own workflow to be able to get an accurate display characterization.
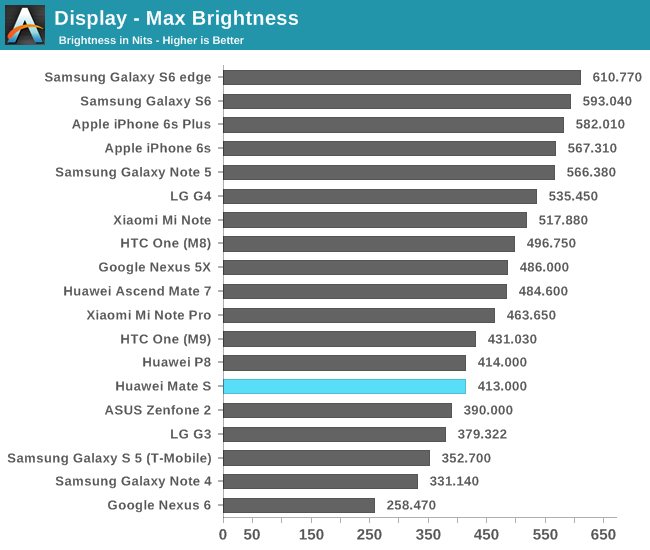
During my intial hands-on with the Mate S I noticed it got quite bright in comparison to usual manual brightness of other AMOLED devices. Indeed, the Mate S is able to go up to 413 cd/m² while traditionally Samsung devices don't exceed 330-350 nits unless you enable auto-brightness in bright lightning conditions. Unfortunately the auto-brightness mode of the Mate S doesn't enable similar boosts so the maximum manual setting on the Mate S is also the maximum the device supports.
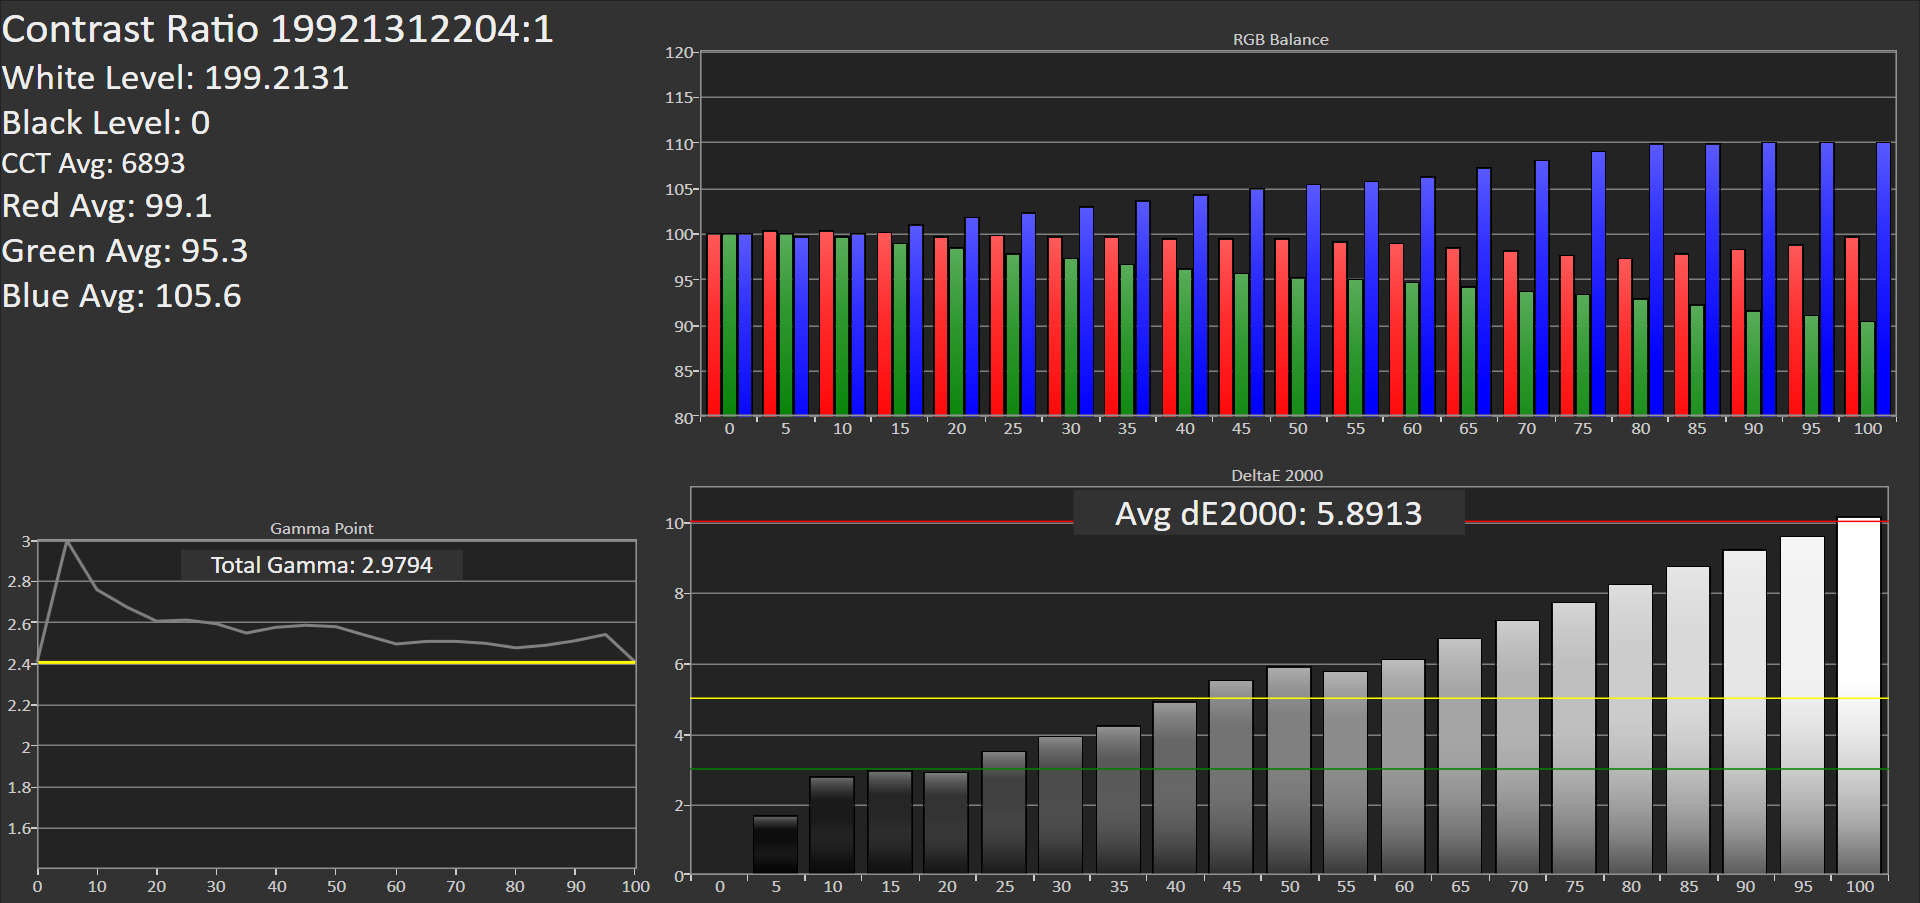
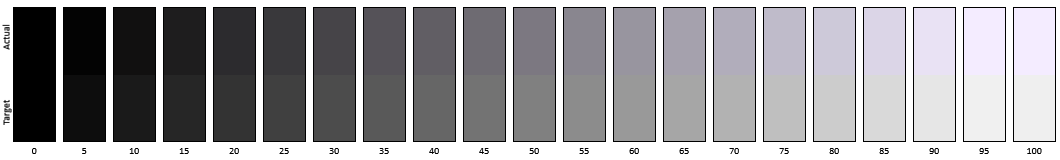
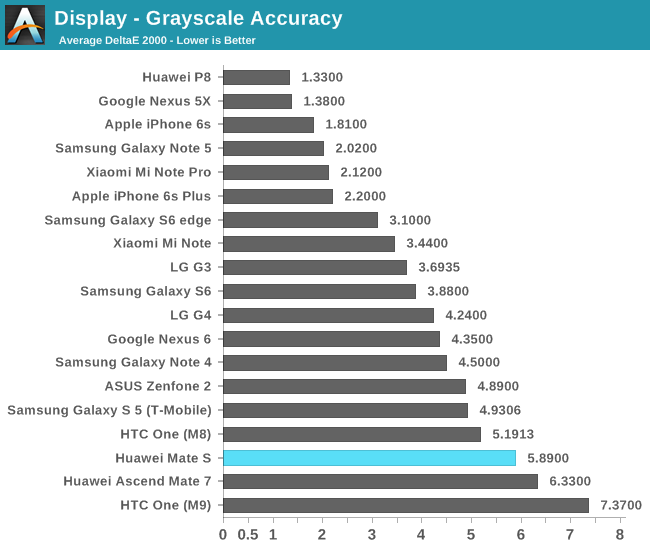
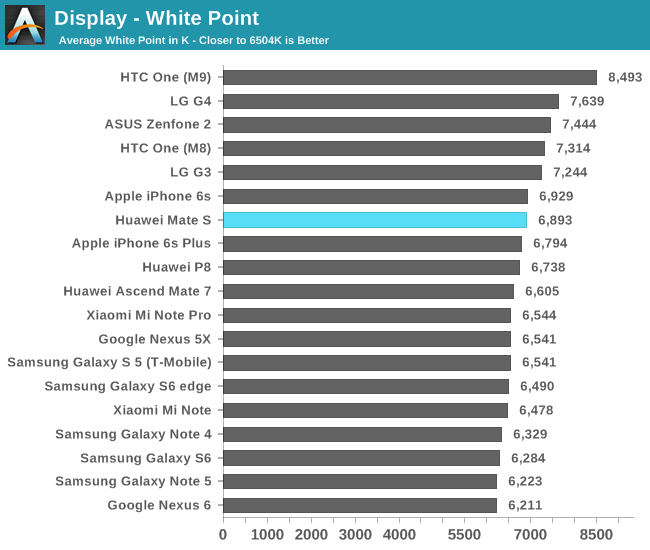
Next, we move to greyscale accuracy testing. Here we see that the Mate S suffers from slight blueish tones as the average colour temperature ends up at 6893K. The dE2000 deviation increases with white value ending up with a total gamma of 2.9 instead of the 2.2 target.
This is rather unfortunate as it had praised the P8's colour accuracy once you set it to minimum colour temperature in the display settings. The Mate S seems to confirm that this was just a one-off coincidence for Huawei as the Mate S's colour temperature slider isn't able to compensate for the bad accuracy results even when I try to hit 6500K with it.

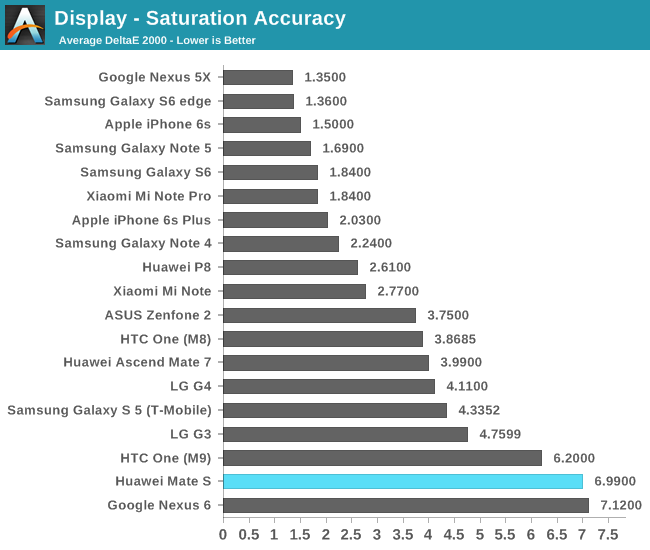

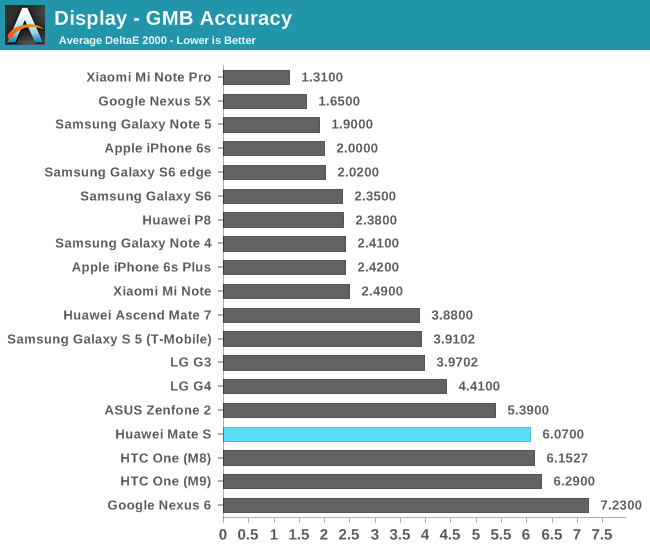
While the Mate S's AMOLED screen represents a large improvement in terms of overall screen quality such as viewing angles and luminance homogenity, it's absolutely not a display that can be considered colour accurate. For people who do not put too much weight into colour accuracy, the vibrant and constrast-rich display might actually be a positive characteristic. In general, the Mate S screen choice does improve over past Huawei devices so it'll definitely be interesting to see how the company will go forward with future devices.
Display Power

We see the Mate S's base power consumption at full black fall in at around 450mW. If accurate, this would fall in around the base power consumption of the Note 4 Exynos. The power here is attributed mostly to various device components such as SoC, DRAM, PMIC and most importantly the DDIC. As the Mate S is only a 1080p device, this is a somewhat disappointing figure but could easily be compensated by an efficient panel.
Unfortuantely, it seems that the Mate S isn't efficient. At 200 cd/m² the Mate S consumes about 769mW of power that can be attributed alone to the increase in luminosity. At maximum brightness, this goes up to 1.75W of screen-power for a total device power of 2.2W. As one can notice in the graph, there's a weird non-linear increase in power for the last measurement point. I investigated this and discovered that at maximum brightness, the screen isn't actually uniformely bright and some parts top off at around ~360 nits while others went to the maximum reached ~410 nits.
| Screen Luminance Power Efficiency 100% APL / White |
||||||
| Device | Screen Luminance Power at 200cd/m² |
Luminance Power (mW) / Screen area (cm²) Efficiency |
||||
| LG G4 | 354 mW | 4.11 | ||||
| Meizu MX4 | 345 mW | 4.14 | ||||
| Huawei P8 | ~341 mW | ~4.43 | ||||
| Meizu MX4 Pro | 386 mW | 4.47 | ||||
| Samsung Galaxy Note 5 | 504 mW | 5.64 | ||||
| Samsung Galaxy S6 | 442 mW | 5.99 | ||||
| Samsung Galaxy S5 | 532 mW | 7.21 | ||||
| Samsung Galaxy Note 4 | 665 mW | 7.22 | ||||
| Samsung Galaxy S5 LTEA | 605 mW | 8.20 | ||||
| LG Flex 2 | 765 mW | 8.89 | ||||
| Samsung Galaxy S4 | 653 mW | 9.22 | ||||
| Huawei Mate S | ~769 mW | ~9.24 | ||||
A few months ago we published a look at AMOLED power efficiency numbers of Samsung Galaxy devices. Since then, I've been able to add in a few more devices to get a better view of overall screen efficiencies. I also decided to present efficiency in mW per cm² of screen area instead of normalizing efficiency values for a certain screen size as I did last time, so this time we have some better concrete values representing real-world physics.
The Mate S falls in extremely close to the efficiency of the Galaxy S4's screen. This is rather unfortunate for a 2015 device as as we can see in the table AMOLED technology has made very large efficiency improvements since then. In fact the Note 5 is currently the most efficienct AMOLED to date and is able to show off a whole 38% better luminance efficiency than the Mate S screen. What is more shocking though is that this represents an over 100% decrease in efficiency when compared to LCD devices such as the P8.
I wish Huawei would have opted for a more efficient AMOLED emitter choice instead what seems to be a cheaper alternative, as this will definitely have an impact on the device's battery life.


54 Comments
View All Comments
tipoo - Wednesday, December 2, 2015 - link
The 4 low power cores seem to consume more power than the high performance core cluster, they just shut off earlier. Curious.With lower core counts in use it shaves off a bit though, but I'm still not convinced big.LITTLE with the same core types is worthwhile. Radically different cores? Sure. Might have more to do with "8" being significant in China.
Exophase - Wednesday, December 2, 2015 - link
You can't say either cluster consumes more or less power than the other because they have different power/frequency curves. The power-optimized cluster may use (marginally) more power near the top of its clock speed but you can see by 1GHz it uses significantly less. I don't know precisely how the two different clusters vary but I would guess that the power optimized cluster sacrifices much voltage/frequency scaling in exchange for much lower leakage.Since the scheduler works with a gap between the "up" and "down" transition points in order to avoid hysteresis it makes sense to have the upper end of the power optimized cluster's performance range exceed the lower end of the performance optimized cluster's. Even if it uses a little more power doing so.
From a pure DVFS standpoint the power consumption curves presented are a fairly convincing argument for why this A53 + "A53e" setup is worthwhile. Either cluster on their own is pretty clearly inferior, either the A53e cluster needing 100+mW while on at its lowest frequency or the A53 cluster incapable of exceeding 1.5GHz. Perhaps a hypothetical implementation in between the two would be "good enough", but I'd argue that if you must use Cortex-A53 cores even a couple hundred extra MHz at the upper end is highly desirable for a lot of users.
Since the utility of DVFS is a foregone conclusion at this point the only real question is if the overhead in transitioning between cores is small enough to make this work as a DVFS system (we'll put aside the extra advantages and complications of a full HMP setup). A lot of people are arguing that it isn't, but I'm not really seeing hard data to support this. I personally believe people underestimate the number of loads that either have low frequency swings in performance requirements or reach a full on steady state for long periods of time. Even on mobile devices.
Andrei Frumusanu - Wednesday, December 2, 2015 - link
Yes, good analysis.Please keep in mind that we might not be seeing the full curves as the vendors simply cut them off where it doesn't make sense. The 1GHz point is extremely important as a pointer as to what the actual physical difference is. Again it's a pity that I can't access the voltages on HiSilicon SoCs otherwise this would be a much easier discussion to back up, but imagine that for the perf cluster the 1GHz spot would basically be the bottom in terms of scaling voltage down at which point race to idle takes over. The other way round for the power cluster, voltages at the top frequencies there might already have reached the high end and thus not be able to go further up in frequency, but on the other side of the curve they're able to go much lower in power.
All in all I think it still makes a lot of sense in terms of implementation.
deskjob - Wednesday, December 2, 2015 - link
Is it me or is this a blatant rip-off of the HTC One series design language?s.yu - Saturday, December 5, 2015 - link
Huawei's been copying designs from this company and that. P8 was some Sony with a little Apple and HTC, lol.fanofanand - Wednesday, December 2, 2015 - link
At the heart of the Mate S we find the HiSilicon Kirin 935. This is the same SoC that was found on the basic model Huawei P8Chart shows 930
Andrei Frumusanu - Wednesday, December 2, 2015 - link
Corrected, thanks. But in truth they're both the same piece of silicon, the 935 is just a marketing name of the higher binned SoC.fanofanand - Wednesday, December 2, 2015 - link
I just know you are a details guy. I love reading your analysis and have bought 2 phones based on your reviews. Keep up the great work and ignore the Apple/Samsung trolls :)Ethos Evoss - Wednesday, December 2, 2015 - link
HUaaaweii smartphonee got battered as usual on this site :DDDAnanadidatechno-tech .. I CANNOT WAIT for Mate 8 review what u gonna say all about it ..
I BETTING on next batter AGAIN :DDD even it has higher specs .. you will describe all as all on bottom graphs :DDD
Don't worry I do not own huawei smartphone anymore.. will see in future.. :)
Ethos Evoss - Wednesday, December 2, 2015 - link
You completelly forgot about Force Touch tho ..