The Intel 6th Gen Skylake Review: Core i7-6700K and i5-6600K Tested
by Ian Cutress on August 5, 2015 8:00 AM ESTDDR4 vs DDR3L on the CPU
One of the big questions when DDR4 was launched was around the comparison to DDR3. Was it better, was it worse? DDR4 by default switches down to an operating voltage of 1.2 volts from 1.5 volts, making it more power efficient, and the standard increases the maximum capacity on an unbuffered memory module. There are also some other enhancements such as per-IC voltage drop control and a design to aid DRAM placement in motherboards. But there was one big scary number – a CAS Latency of 15 (known as C15 or CL15).
Let’s do a quick memory recap on frequency (technically, transfer rate but used interchangeably for this purpose) against latency.
The CAS latency is the number of clocks taken between an access request from the memory controller to actually acting on that request. So a CL of 15 means that there are 15 clocks between that request and getting access. Generally, a lower CL is better.
The Frequency is the rate at which those clocks occur. DDR stands for Double Data Rate, which means that in one hertz in the frequency there are two requests – one each on the rise and fall of the clock signal. The reciprocal of the frequency/transfer rate (one divided by the frequency) is the time taken to perform a clock.
But the important thing here is that the latency is a number of clocks and thus is just a number, and the frequency determines how fast these clocks go. So on its own the CAS Latency value doesn’t say much. The important metric is when the two are used together -the true latency is the CAS Latency * Time taken per clock, and here’s a table of values from Crucial’s recent whitepaper on the subject:
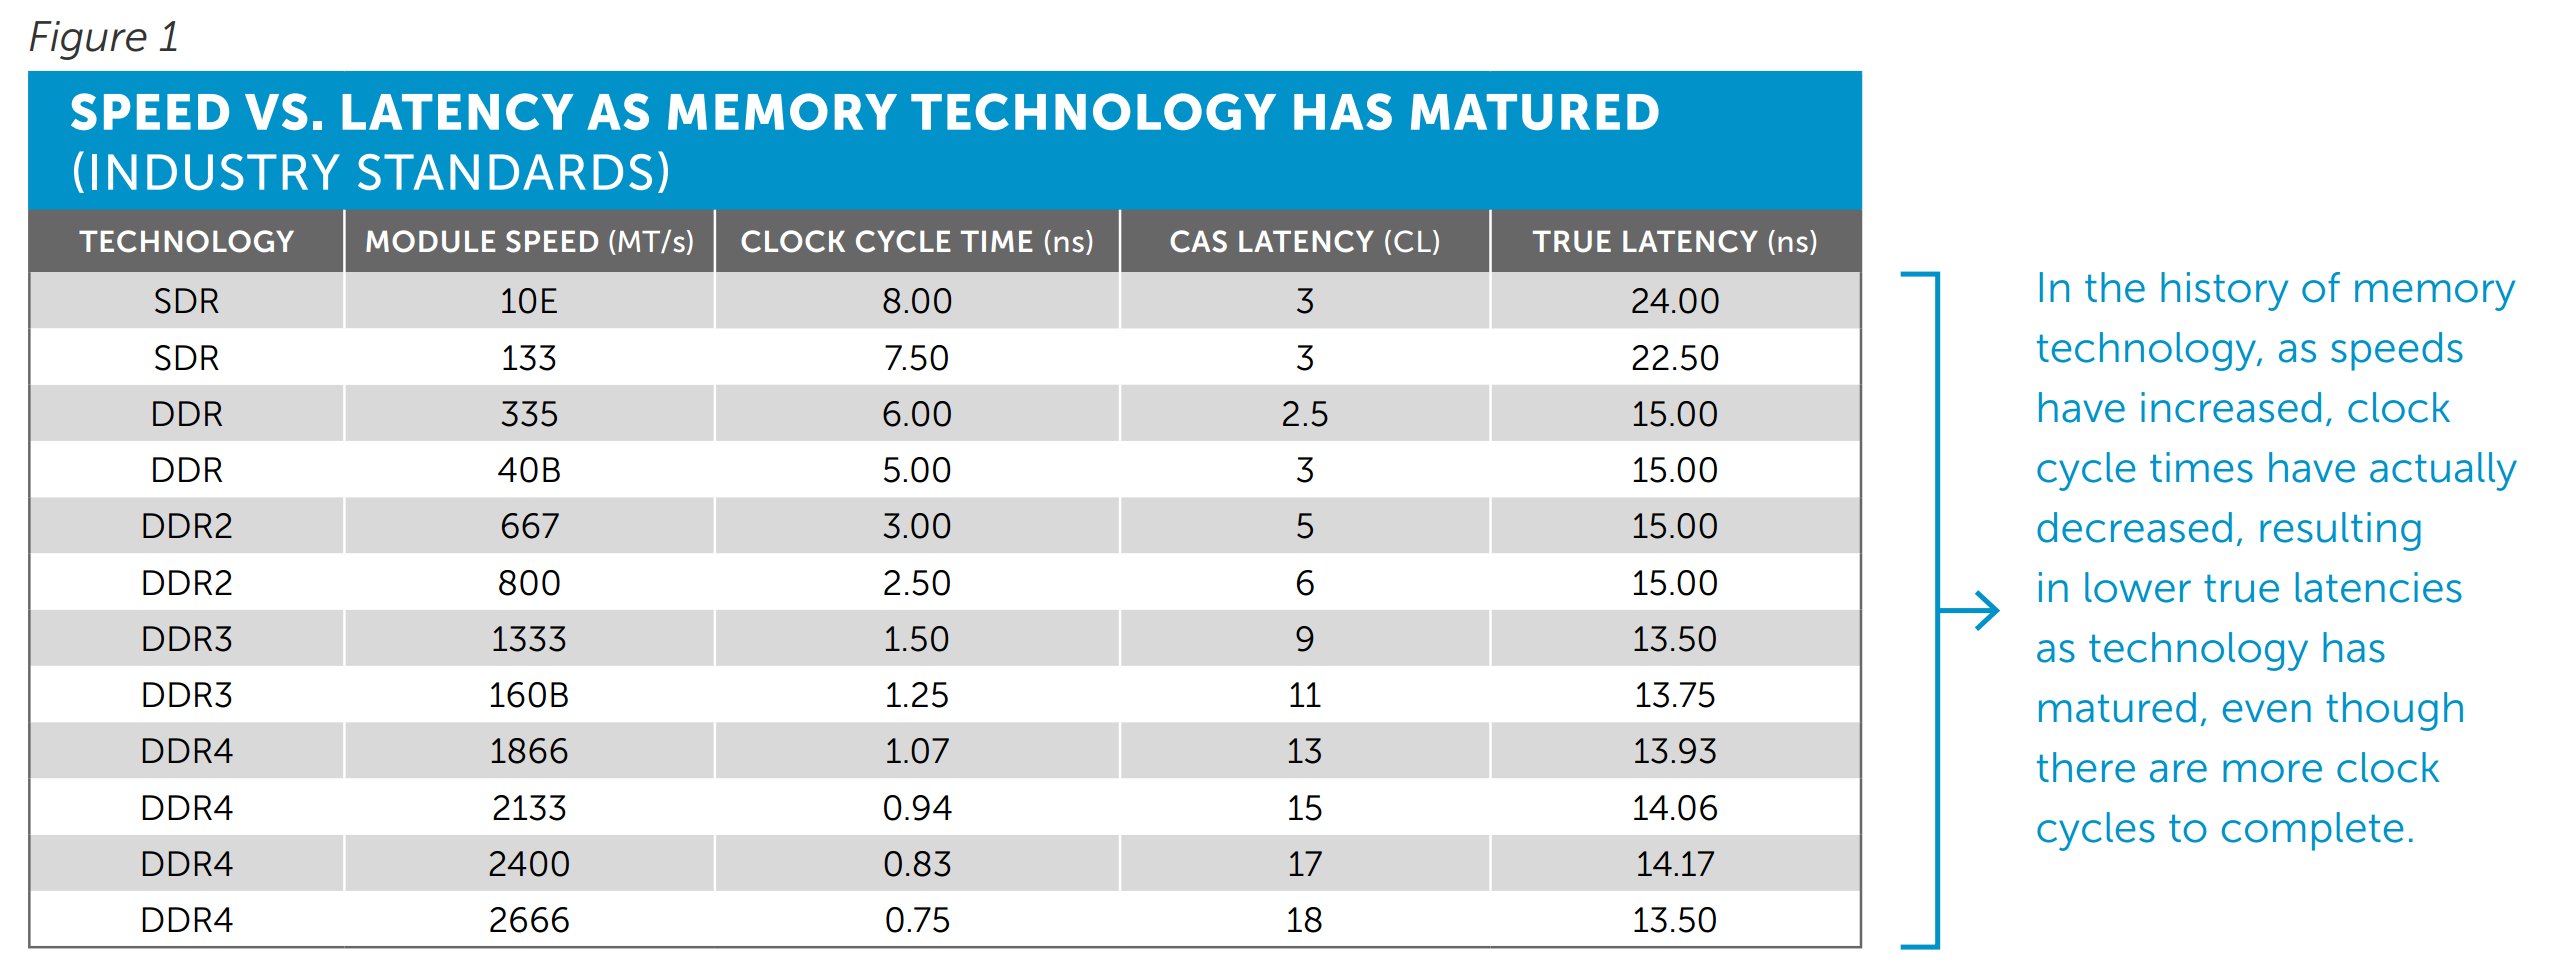
So here we have the values for True Latency:
DDR3-1600 C11: 13.75 nanoseconds
DDR4-2133 C15: 14.06 nanoseconds
In fact despite the development of new memory interfaces, the true latency for DRAM under default specifications has stayed roughly the same since DDR. As we make faster memory modules, the CAS Latency rises to keep higher frequency memory stable, but overall the true latency stays the same.
Normally in our DRAM reviews I refer to the performance index, which has a similar effect in gauging general performance:
DDR3-1600 C11: 1600/11 = 145.5
DDR4-2133 C15: 2133/15 = 142.2
As you have faster memory, you get a bigger number, and if you reduce the CL, we get a bigger number also. Thus for comparing memory kits, if the difference > 10, then the kit with the biggest performance index tends to win out, though for similar kits the one with the highest frequency is preferred.
“But who uses DDR3-1600 C11? Isn’t most memory like DDR3-1866 C9?”
This is valid point – as DDR3 has matured, the number of kits in the market that are running faster than default specifications are actually normal now. The performance index for this kit is:
DDR3-1866 C9: 1866/9 = 207.3
In the grand scheme of things, a PI of 207 is actually quite large, and super high for DDR3L. There are a few DDR3 memory kits that go beyond this up to a PI of 220, or an overclock might go to 240 beyond normal voltages, but a value of 207 shows the maturity of the DDR3 market. If we look at the current DDR4 market, we can pick up kits with DDR4-3000 C15 ratings, which are similarly in the 200 bracket now too.
I’ve prefaced our DDR3L vs DDR4 testing with all this as a response to ‘large CL = bad’. Actually, you have to compare both numbers. Now that we have a platform that runs both, and we were able to source a beta DDR3L/DDR4 combination motherboard to test them on, we can see how it squares up from ‘regular DDR4’ against ‘high performance DDR3(L)’.
For these tests, both sets of numbers were run at 3.0 GHz with hyperthreading disabled. Memory speeds were DDR4-2133 C15 and DDR3-1866 C9 respectively.
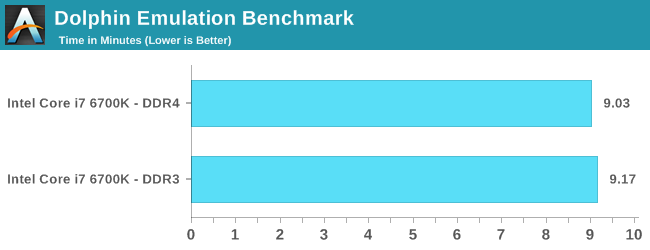
Dolphin Benchmark: link
Many emulators are often bound by single thread CPU performance, and general reports tended to suggest that Haswell provided a significant boost to emulator performance. This benchmark runs a Wii program that raytraces a complex 3D scene inside the Dolphin Wii emulator. Performance on this benchmark is a good proxy of the speed of Dolphin CPU emulation, which is an intensive single core task using most aspects of a CPU. Results are given in minutes, where the Wii itself scores 17.53 minutes.
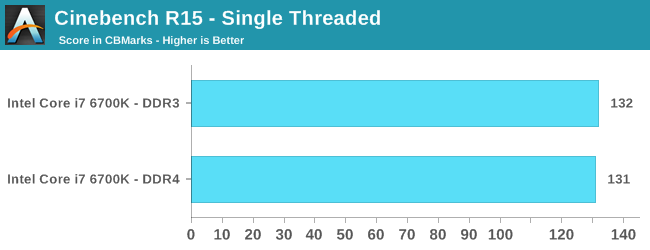
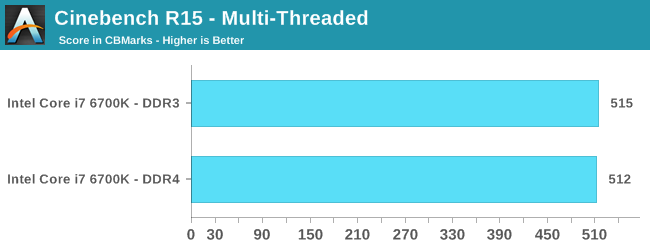
Cinebench R15
Cinebench is a benchmark based around Cinema 4D, and is fairly well known among enthusiasts for stressing the CPU for a provided workload. Results are given as a score, where higher is better.
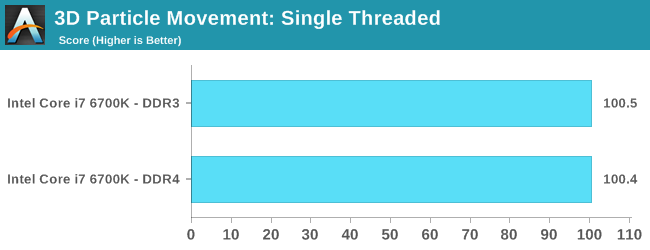
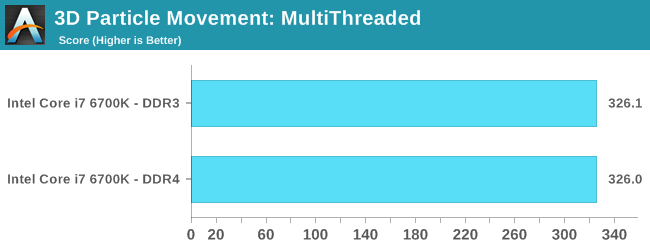
Point Calculations – 3D Movement Algorithm Test: link
3DPM is a self-penned benchmark, taking basic 3D movement algorithms used in Brownian Motion simulations and testing them for speed. High floating point performance, MHz and IPC wins in the single thread version, whereas the multithread version has to handle the threads and loves more cores. For a brief explanation of the platform agnostic coding behind this benchmark, see my forum post here.
Compression – WinRAR 5.0.1: link
Our WinRAR test from 2013 is updated to the latest version of WinRAR at the start of 2014. We compress a set of 2867 files across 320 folders totaling 1.52 GB in size – 95% of these files are small typical website files, and the rest (90% of the size) are small 30 second 720p videos.
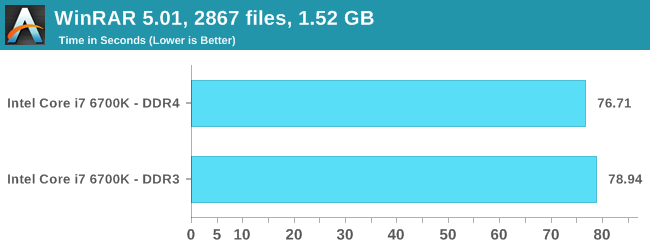
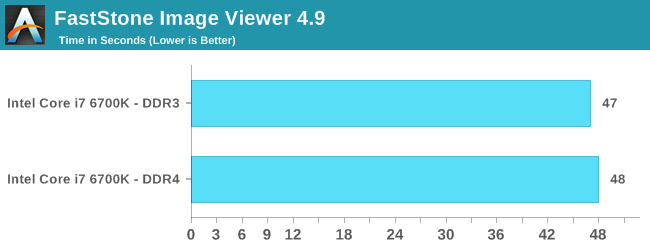
Image Manipulation – FastStone Image Viewer 4.9: link
Similarly to WinRAR, the FastStone test us updated for 2014 to the latest version. FastStone is the program I use to perform quick or bulk actions on images, such as resizing, adjusting for color and cropping. In our test we take a series of 170 images in various sizes and formats and convert them all into 640x480 .gif files, maintaining the aspect ratio. FastStone does not use multithreading for this test, and thus single threaded performance is often the winner.
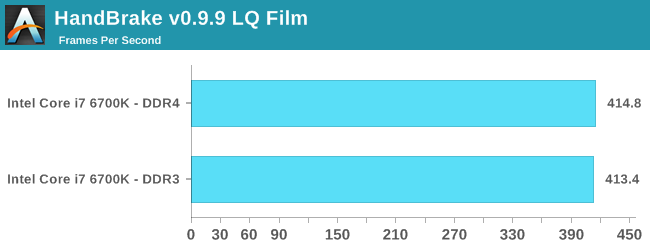
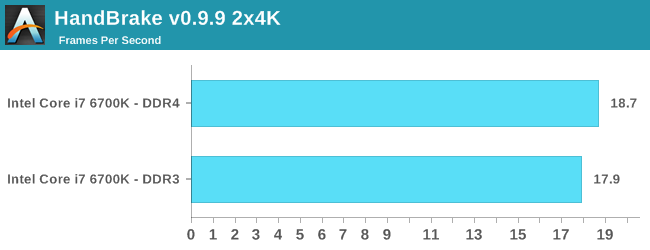
Video Conversion – Handbrake v0.9.9: link
Handbrake is a media conversion tool that was initially designed to help DVD ISOs and Video CDs into more common video formats. The principle today is still the same, primarily as an output for H.264 + AAC/MP3 audio within an MKV container. In our test we use the same videos as in the Xilisoft test, and results are given in frames per second.
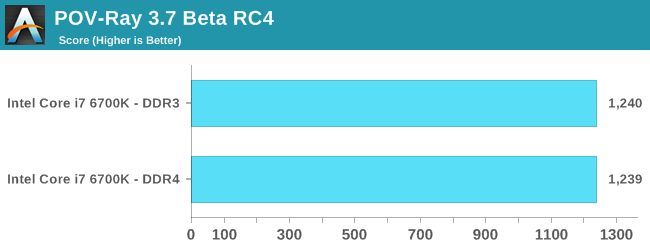
Rendering – PovRay 3.7: link
The Persistence of Vision RayTracer, or PovRay, is a freeware package for as the name suggests, ray tracing. It is a pure renderer, rather than modeling software, but the latest beta version contains a handy benchmark for stressing all processing threads on a platform. We have been using this test in motherboard reviews to test memory stability at various CPU speeds to good effect – if it passes the test, the IMC in the CPU is stable for a given CPU speed. As a CPU test, it runs for approximately 2-3 minutes on high end platforms.
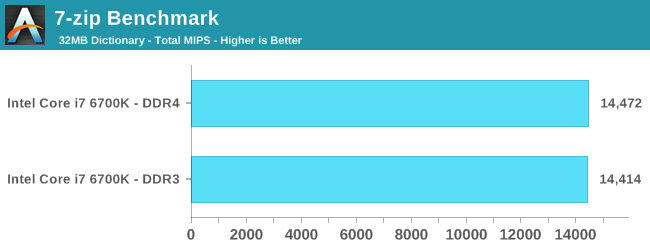
Synthetic – 7-Zip 9.2: link
As an open source compression tool, 7-Zip is a popular tool for making sets of files easier to handle and transfer. The software offers up its own benchmark, to which we report the result.
Overall: DDR4 vs DDR3L on the CPU
Pretty sure the results speak for themselves:
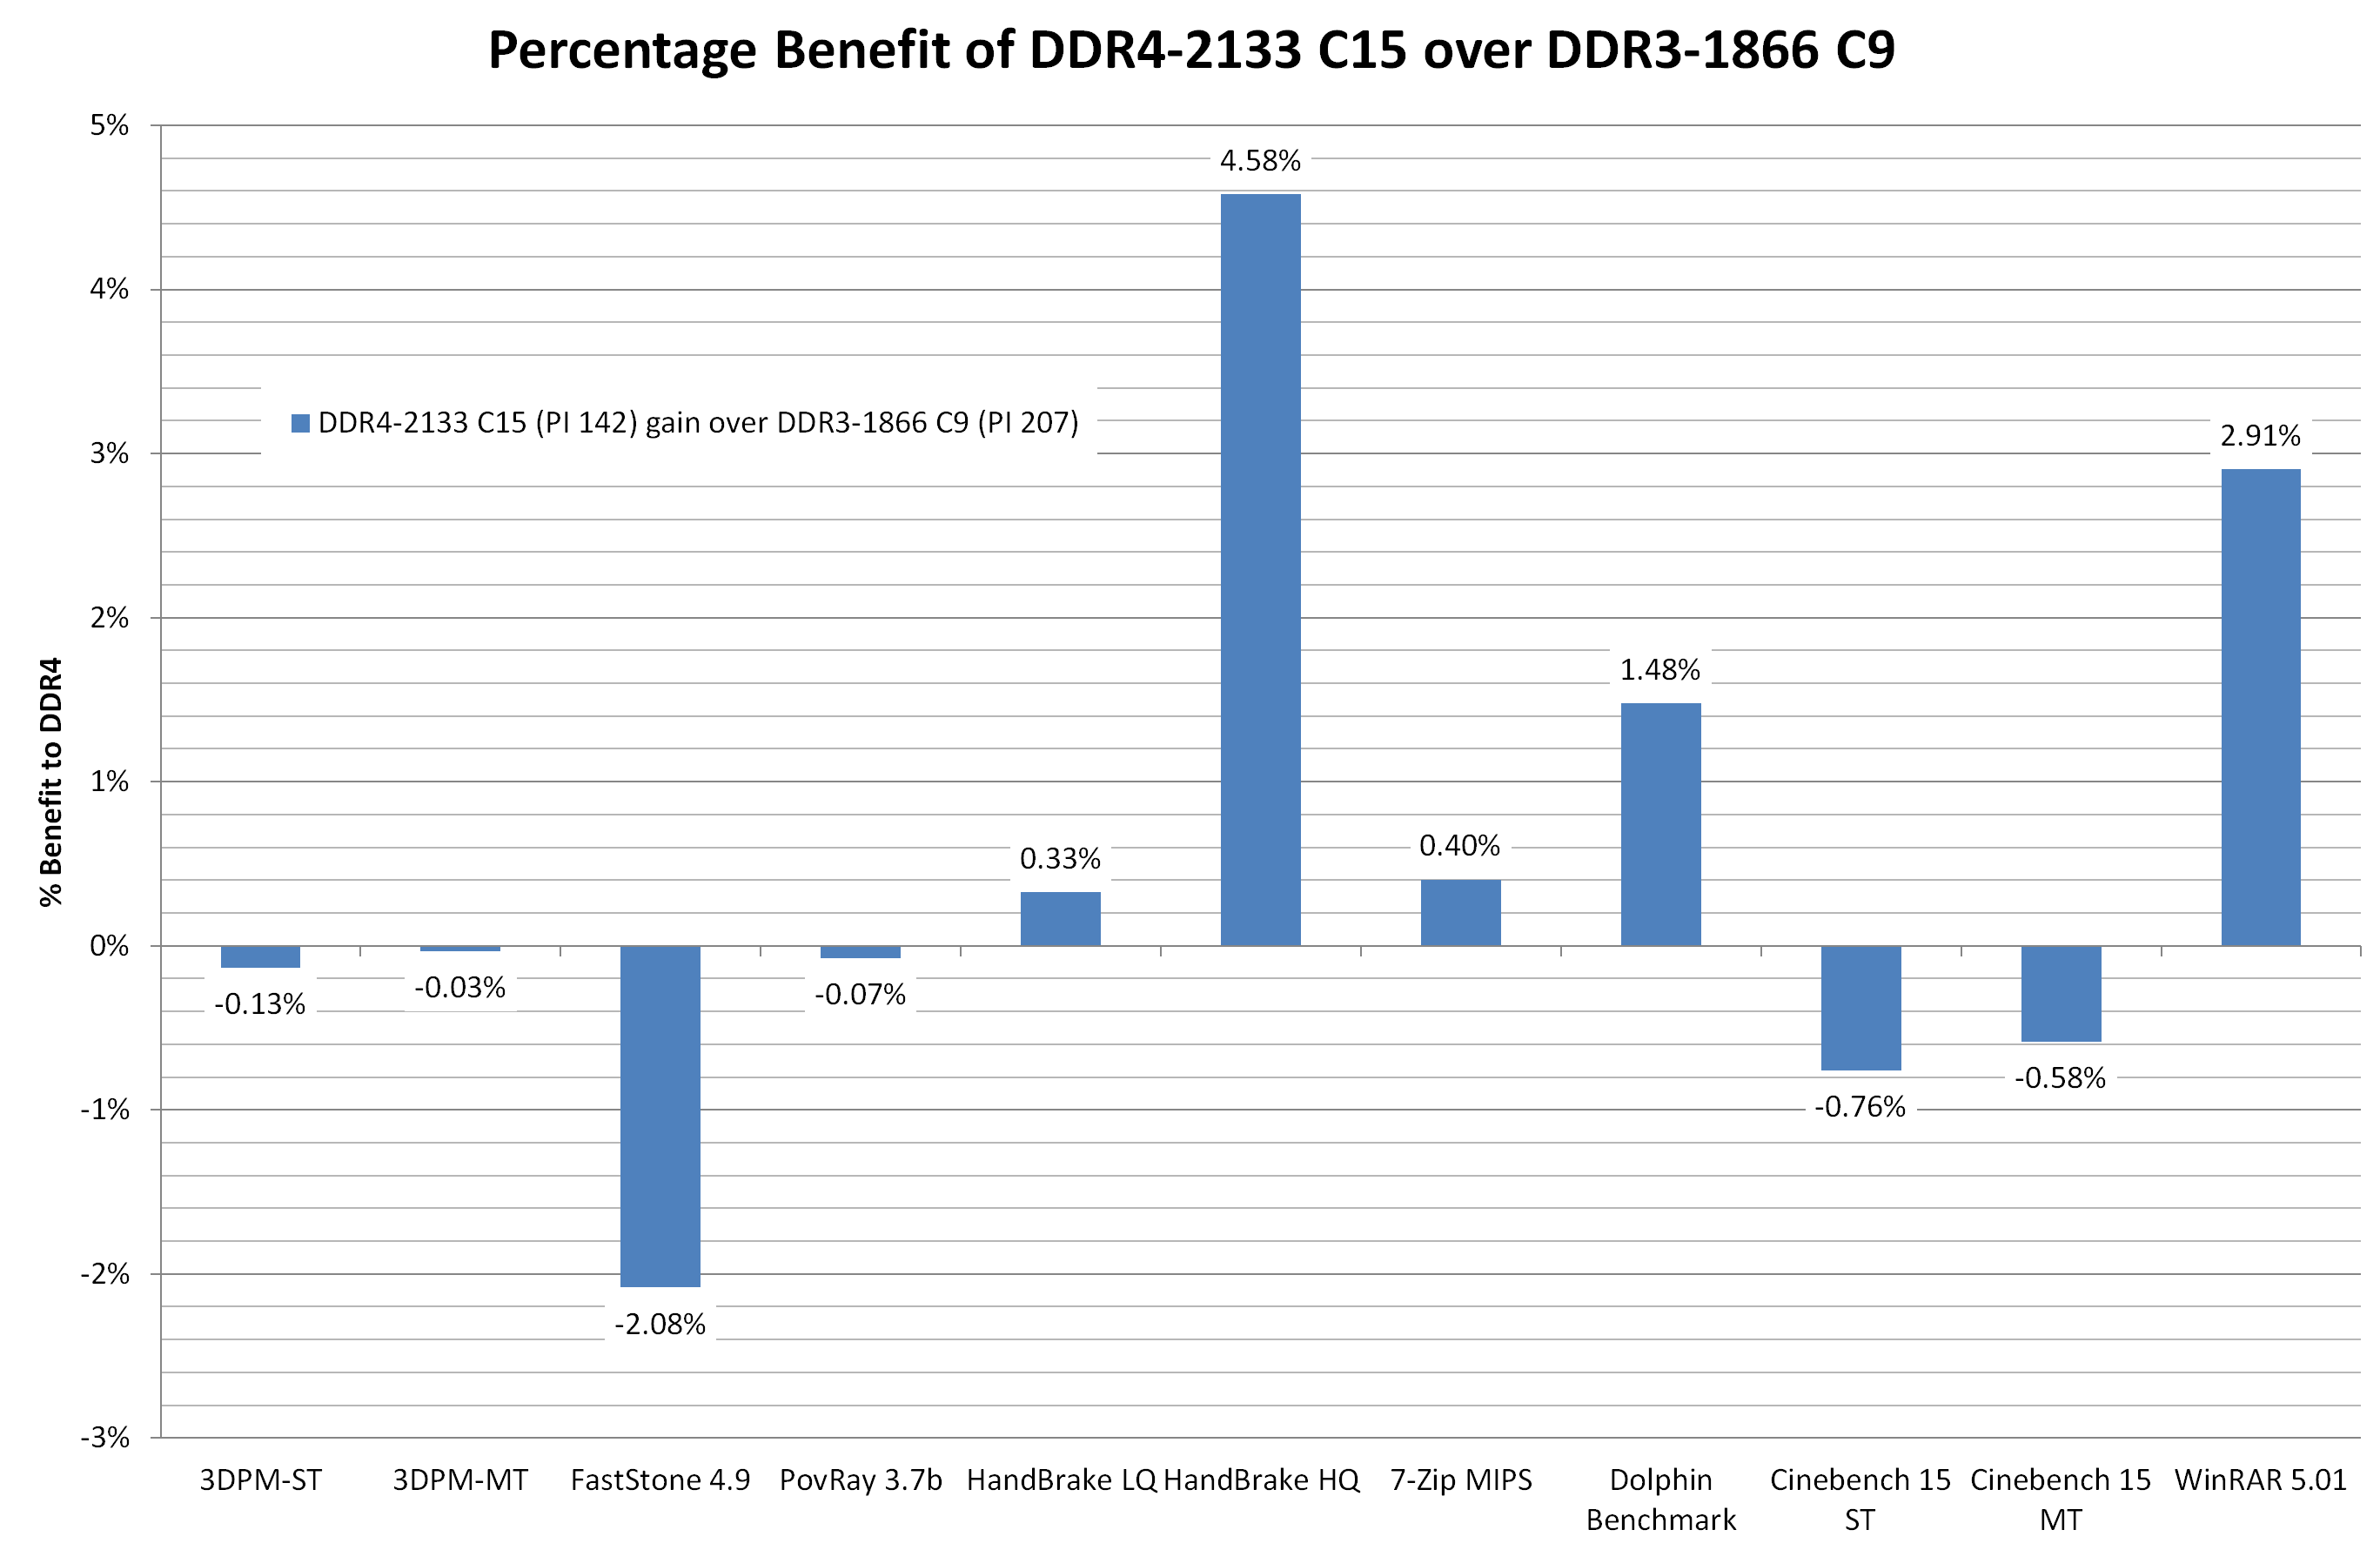
Comparing default DDR4 to a high performance DDR3 memory kit is almost an equal contest. Having the faster frequency helps for large frame video encoding (HandBrake HQ) as well as WinRAR which is normally memory intensive. The only real benchmark loss was FastStone, which regressed by one second (out of 48 seconds).
End result, looking at the CPU test scores, is that upgrading to DDR4 doesn’t degrade performance from your high end DRAM kit, and you get the added benefit of future upgrades, faster speeds, lower power consumption due to the lower voltage and higher density modules.


477 Comments
View All Comments
nsteussy - Tuesday, August 11, 2015 - link
Ian, under the Linux benchmarks you have the graphic for the NAMD Mol Dynamics twice but none for the NPB fluid dynamics. That said, that is quite the nice bump for NAMD (~24% from a 4770 to a 6770). Very tempting.Visual - Wednesday, August 12, 2015 - link
I kinda don't like how you keep repeating the generic benchmark descriptions before each graph. I'd prefer if it were hidden by default, visible on hover or toggled by clicking of some info button or similar, or at the very least formatted a bit different than actual article text.I'd also like if you had some comments on the actual results, at least where there are some peculiarities in them.
Case in point: Why is the 5775C IGP so much better in some games?
mapesdhs - Wednesday, August 12, 2015 - link
Agree re comments on results, eg. why does the 2600K dip so badly for Shadow of Mordor @ 4K with the GTX 770? It doesn't happen with the 980, but if the dip was a VRAM issue @ 4K then the 3770K shouldn't be so close to the other CPUs. Weird...wyssin - Wednesday, August 12, 2015 - link
Has anyone published a review comparing i7-6700k with other cpus all overclocked to, say, 4.5 GHz? For those who typically run an overclocked system, it's not an apples-to-apples comparison to put the new entry up against the older all at stock settings.So to make the best-informed decision, it would be very useful to be able to see head-to-head trials at both (1) stock settings and (2) overclocked to a speed they can all reasonably manage (apparently around 4.4 or 4.5 GHz).
I have the same problems with the Guru3D review and the Gamestar.de review that were mentioned in earlier comments.
Oxford Guy - Thursday, August 13, 2015 - link
The key is to pick a speed that the worst overclocking examples would be able to get to with reasonable voltage. That takes the luck of the draw out of the scenario.beatsbyden - Thursday, August 13, 2015 - link
Not much improvent. Only worth the money if you're coming from an I5Darkvengence - Thursday, August 13, 2015 - link
This lack of CPU power needed in gaming is only temporary once u have photorealistic graphics in 4k u gonna need crazy powerful GPUs which need feeding by beastly CPUs . our current technology will seem like a dinosaur CPU in comparison. That is of course a fair few years away but still one day it will happen . I'm glad current CPU are not being taxed by today's games even less with dx12. Gives my gen 1 MSI nightblade more life with 4970k as u can't change motherboard it all custom front panel connectors and stuff. I used to have a i7 920 and got to say that is still a good CPU especially for single GPU systems. I really like sandy bridge tho very impressive for its age. But older CPUs lose out mainly being tied to older chipsets so u lose new connector and bus speeds for hardware thogasparmx - Thursday, November 19, 2015 - link
I think you're kinda wrong, the point of DX12 is depending less on CPU, NVIDIA says in the future probably you're not going to need a beast CPU to play 4k games.djscrew - Friday, August 14, 2015 - link
I'm so disappointed in SB/DDR4. After all this wait and the IPC gains with discreet graphics are negative? WTF Intel. I Guess my Nehalem system will survive another generation, or maybe three? No compelling reason to upgrade. It's such a shame because I was really looking forward to building a $3k rig. I think I'll shop for a nice 4k panel instead.Ninjawithagun - Friday, August 14, 2015 - link
And just when I was about to purchase the 6600K and a Z170 mini-ITX motherboard as an upgrade to my 4690K and Z97i Plus motherboard...man, am I glad I ran across this article. Saved myself about $600 for a useless upgrade!