The Intel Broadwell Review Part 2: Overclocking, IPC and Generational Analysis
by Ian Cutress on August 3, 2015 8:00 AM ESTComparing IPC: Memory Latency and CPU Benchmarks
Being able to do more with less, in the processor space, allows both the task to be completed quicker and often for less power. While the concept of having multiple cores has allowed many programs to be run at once, such as IM, web, compute and so forth, we are all still limited by the fact that a lot of software is still relying on one line of code after another, pegging each software package to once core unless it can exploit a mulithreaded list of operations. This is referred to as the serial part of the software, and is the basis for many early programming classes – getting the software to compile and complete is more important than speed. But the truth is that having a few fast cores helps more than several thousand super slow cores. This is where Instructions Per Clock (IPC) comes in to play.
The principles behind extracting IPC are quite complex as one might imagine. Ideally every instruction a CPU gets should be read, executed and finished in one cycle, however that is never the case. The processor has to take the instruction, decode the instruction, gather the data (depends on where the data is), perform work on the data, then decide what to do with the result. Moving has never been more complicated, and the ability for a processor to hide latency, pre-prepare data by predicting future events or keeping hold of previous events for potential future use is all part of the plan. All the meanwhile there is an external focus on making sure power consumption is low and the frequency of the processor can scale depending on what the target device actually is.
For the most part, Intel has successfully increased IPC every generation of processor. In most cases, 5-10% with a node change and 5-25% with an architecture change with the most recent large jumps being with the Core architecture and the Sandy Bridge architectures, ushering in new waves of super-fast computational power. As Haswell to Broadwell is a node change with minor silicon updates, we should expect some gain but the main benefit should be efficiency by moving to a smaller node.
For this test we took Intel’s high-end i7 processors from the last four generations and set them to 3.0 GHz and with HyperThreading disabled. As each platform uses DDR3, we set the memory across each to DDR3-1866 with a CAS latency of 9. From a pure cache standpoint, here is how each of the processors performed:
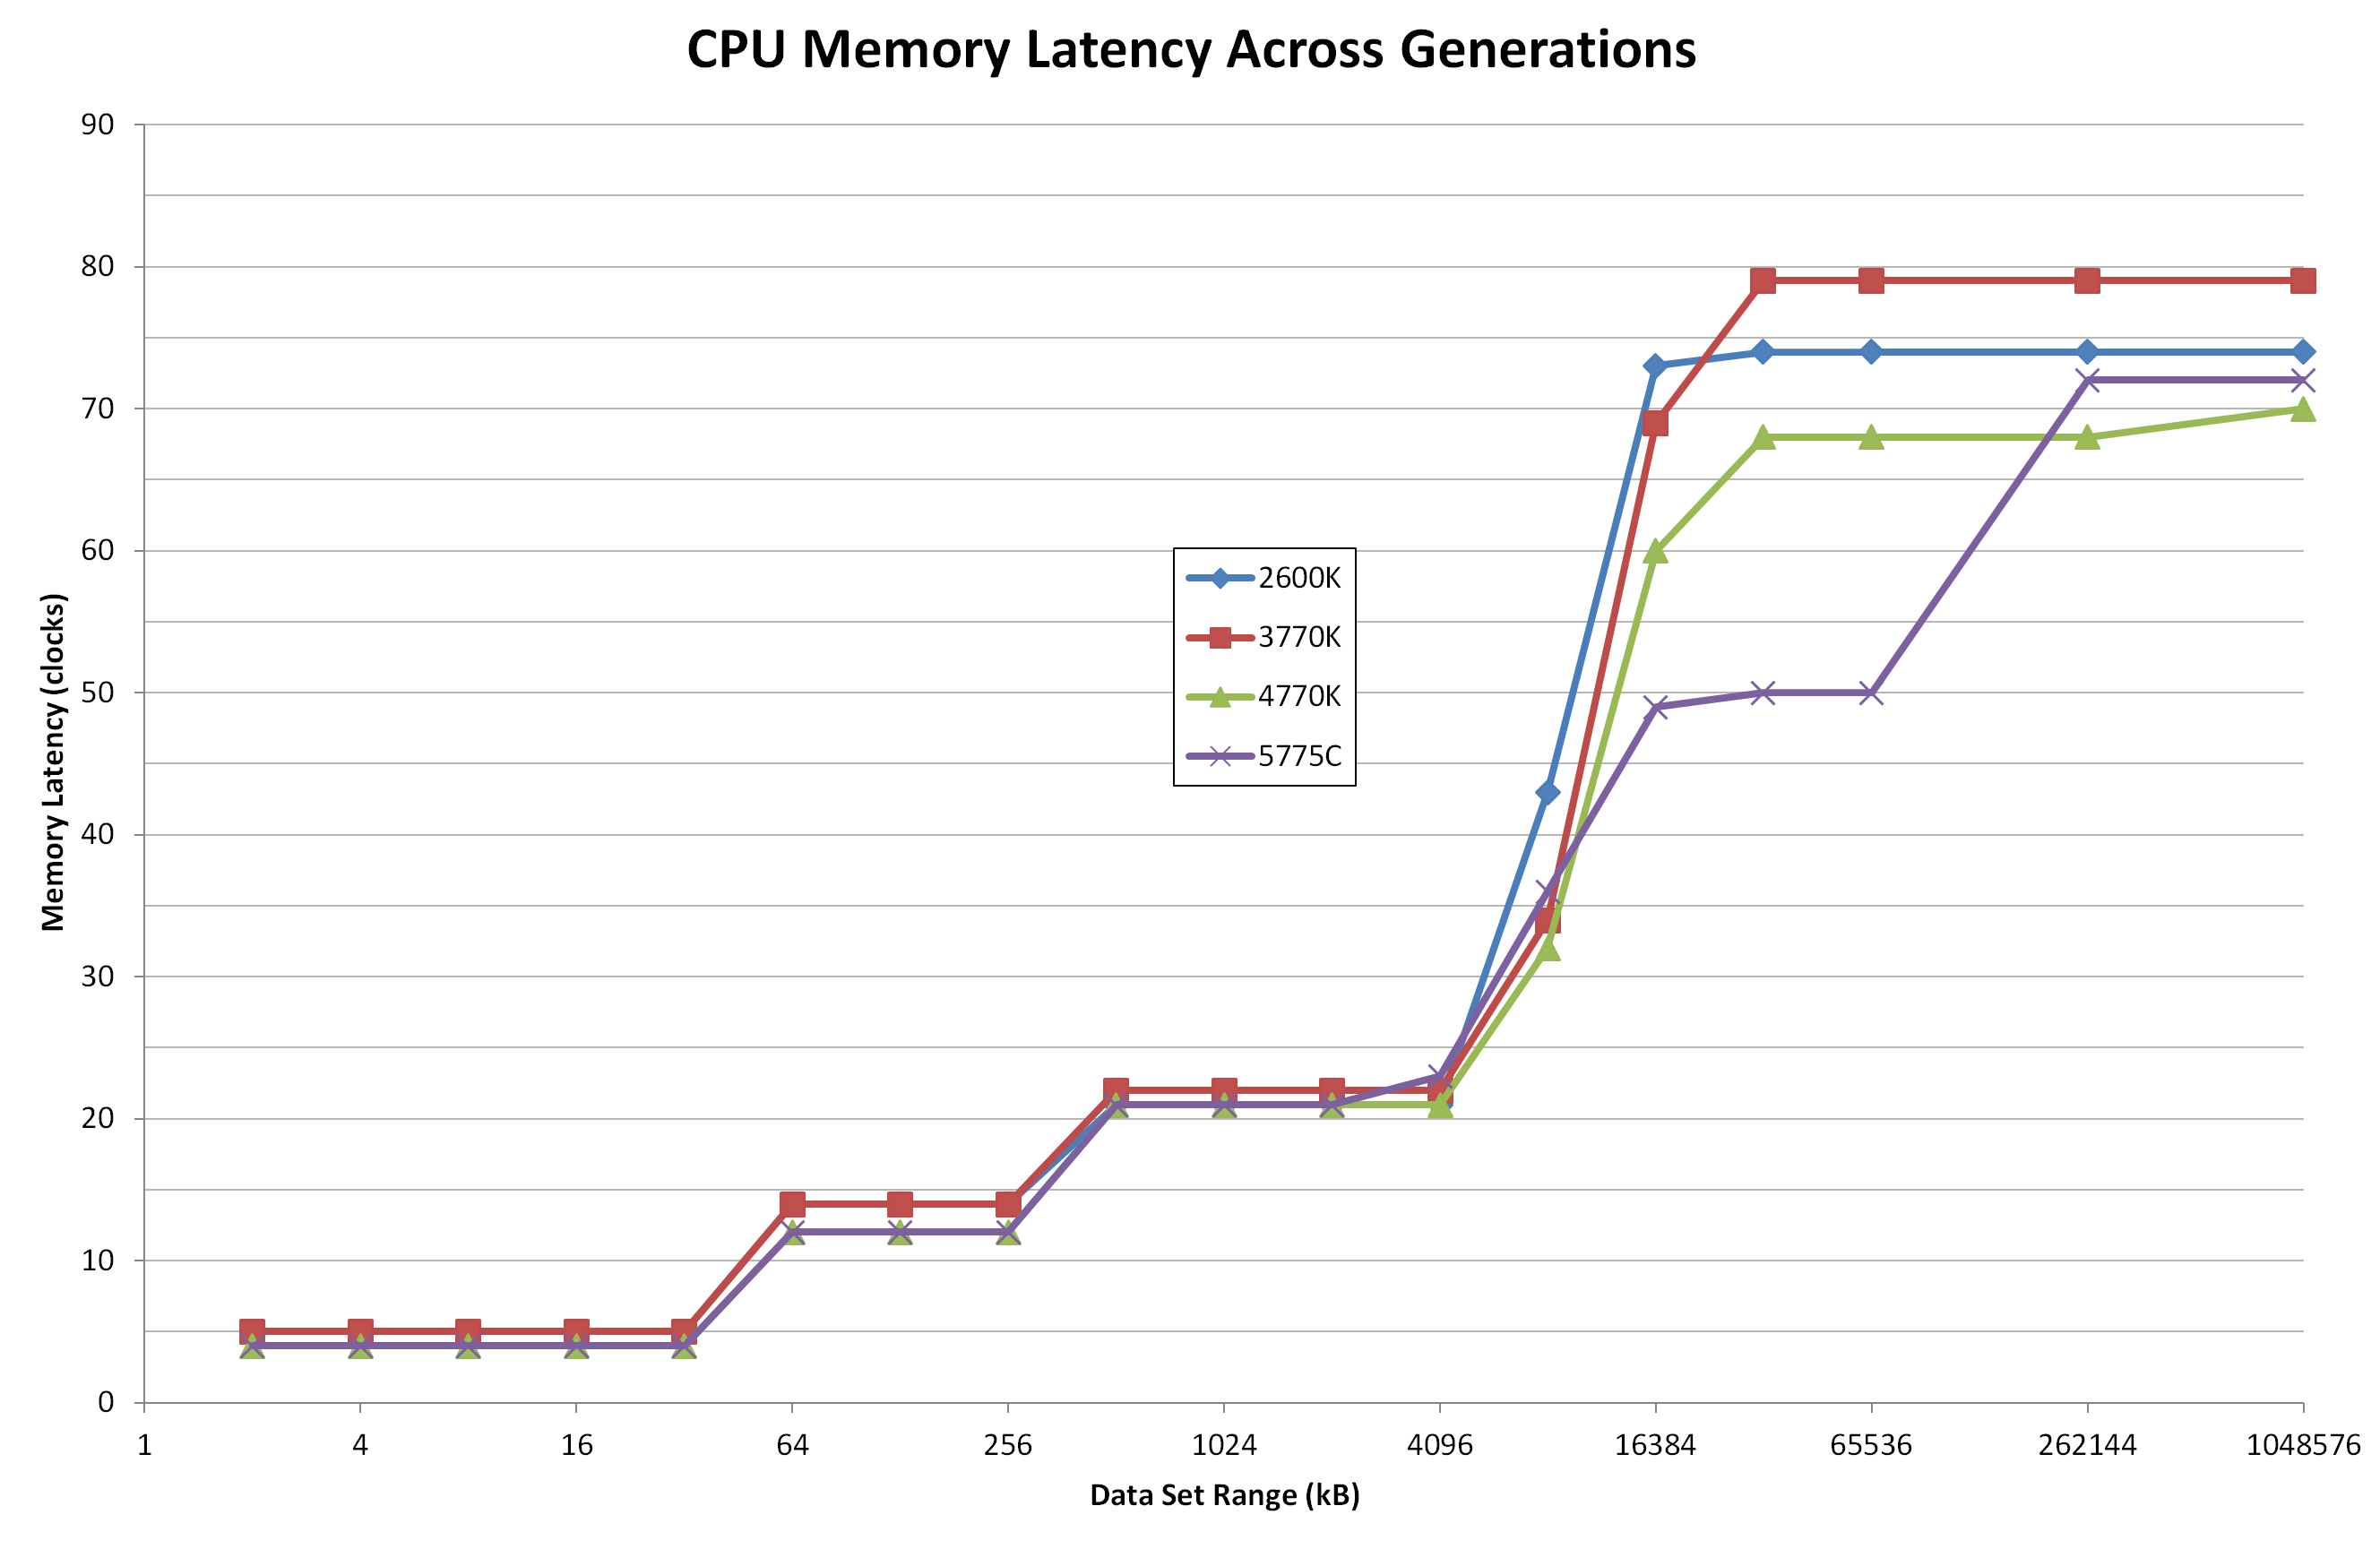
Both Haswell and Broadwell have a small lead through the Level 1 Cache (32kB) and Level 2 Cache (256kB). It all changes from 6MB onwards as a result of the different cache levels between the processors. As the Broadwell based i7-5775C only has 6MB of L3 cache, this seems to effect the 4MB data set range, but between 8MB and 64MB values, the memory latency for Broadwell is substantially lower than any other Intel processor. This comes down to the eDRAM, which sticks around until 128MB.
Most memory accesses happen at lower data set ranges as the system attempts to predict the data needed. When data is not in the L1 cache, it is considered a cache miss and looks for the data in L2. When not in L2, look in L3. When not in L3, look in eDRAM/DDR3. From this perspective, the Broadwell based processors should have a slight advantage when it comes to large amounts of data accesses. Based on our previous testing, this means integrated graphics or high intensity CPU/DRAM workloads such as databases or matrix operations.
Here are the CPU results at 3.0 GHz:
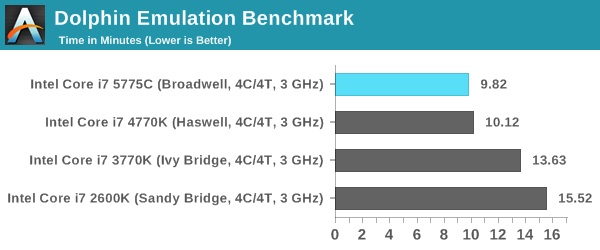
Dolphin Benchmark: link
Many emulators are often bound by single thread CPU performance, and general reports tended to suggest that Haswell provided a significant boost to emulator performance. This benchmark runs a Wii program that raytraces a complex 3D scene inside the Dolphin Wii emulator. Performance on this benchmark is a good proxy of the speed of Dolphin CPU emulation, which is an intensive single core task using most aspects of a CPU. Results are given in minutes, where the Wii itself scores 17.53 minutes.
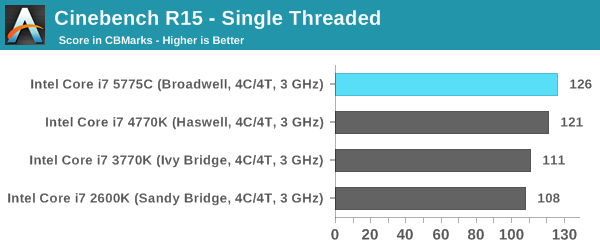
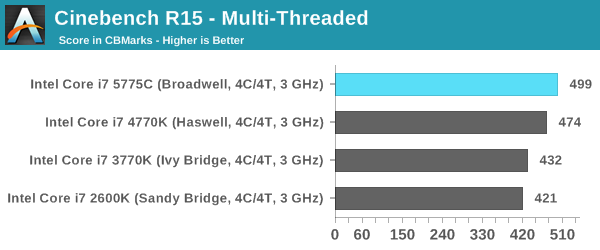
Cinebench R15
Cinebench is a benchmark based around Cinema 4D, and is fairly well known among enthusiasts for stressing the CPU for a provided workload. Results are given as a score, where higher is better.
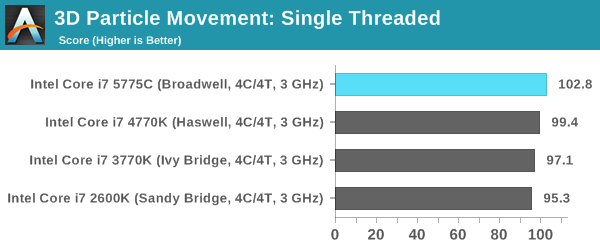
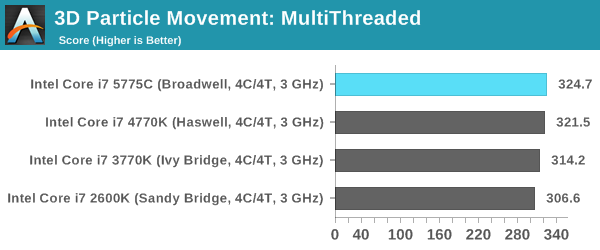
Point Calculations – 3D Movement Algorithm Test: link
3DPM is a self-penned benchmark, taking basic 3D movement algorithms used in Brownian Motion simulations and testing them for speed. High floating point performance, MHz and IPC wins in the single thread version, whereas the multithread version has to handle the threads and loves more cores. For a brief explanation of the platform agnostic coding behind this benchmark, see my forum post here.
Compression – WinRAR 5.0.1: link
Our WinRAR test from 2013 is updated to the latest version of WinRAR at the start of 2014. We compress a set of 2867 files across 320 folders totaling 1.52 GB in size – 95% of these files are small typical website files, and the rest (90% of the size) are small 30 second 720p videos.
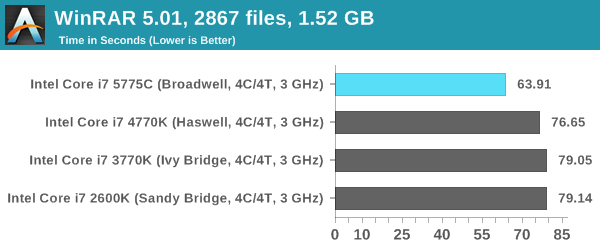
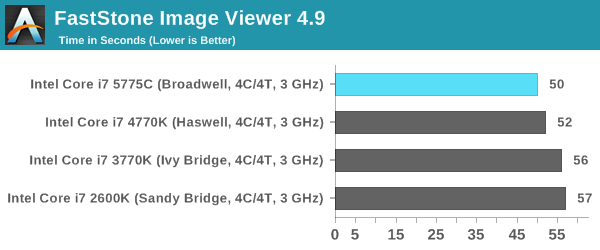
Image Manipulation – FastStone Image Viewer 4.9: link
Similarly to WinRAR, the FastStone test us updated for 2014 to the latest version. FastStone is the program I use to perform quick or bulk actions on images, such as resizing, adjusting for color and cropping. In our test we take a series of 170 images in various sizes and formats and convert them all into 640x480 .gif files, maintaining the aspect ratio. FastStone does not use multithreading for this test, and thus single threaded performance is often the winner.
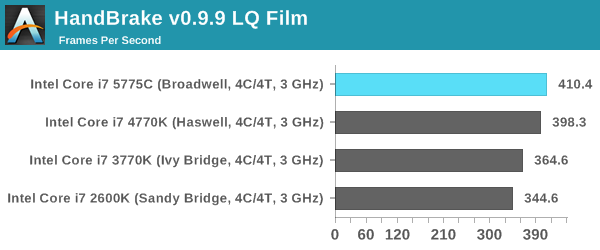
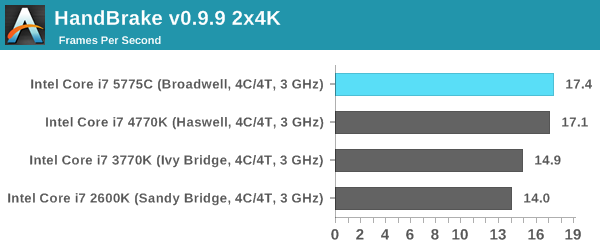
Video Conversion – Handbrake v0.9.9: link
Handbrake is a media conversion tool that was initially designed to help DVD ISOs and Video CDs into more common video formats. The principle today is still the same, primarily as an output for H.264 + AAC/MP3 audio within an MKV container. In our test we use the same videos as in the Xilisoft test, and results are given in frames per second.
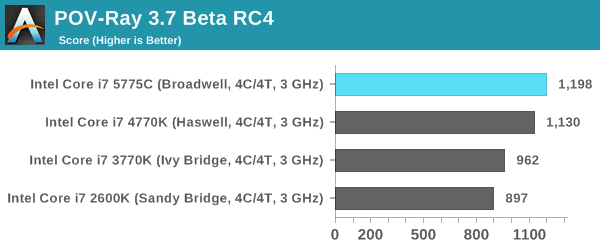
Rendering – PovRay 3.7: link
The Persistence of Vision RayTracer, or PovRay, is a freeware package for as the name suggests, ray tracing. It is a pure renderer, rather than modeling software, but the latest beta version contains a handy benchmark for stressing all processing threads on a platform. We have been using this test in motherboard reviews to test memory stability at various CPU speeds to good effect – if it passes the test, the IMC in the CPU is stable for a given CPU speed. As a CPU test, it runs for approximately 2-3 minutes on high end platforms.
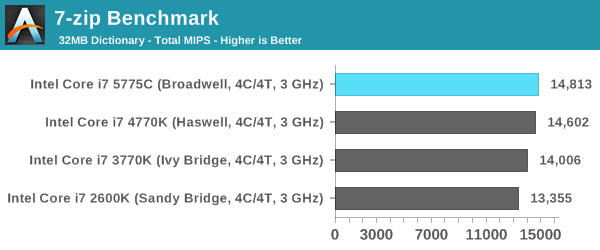
Synthetic – 7-Zip 9.2: link
As an open source compression tool, 7-Zip is a popular tool for making sets of files easier to handle and transfer. The software offers up its own benchmark, to which we report the result.
Overall: CPU IPC
*When this section was published initially, the timed benchmarks (those that rely on time rather than score) were caluclated incorrectly. The text has been updated to reflect the new calculations.
Removing WinRAR as a benchmark that obviously benefits from the eDRAM, we get an interesting look at how each generation has evolved over time. Taking Sandy Bridge (i7-2600K) as the base, we get the following:

As we can see, performance gains are everywhere although the total benefit is highly dependent on the benchmark in question. Cinebench in single threaded mode for example gives a 16.7% gain from Sandy Bridge to Broadwell, however Dolphin which is also single threaded gets a 58.1% improvement. Overall, a move from Sandy Bridge to Broadwell from an IPC perspective gives an average ~21% improvement. That is an increase in pure, raw throughput before considering frequency or any differentiator in core counts.
If we adjust this graph to show generation to generation improvement:
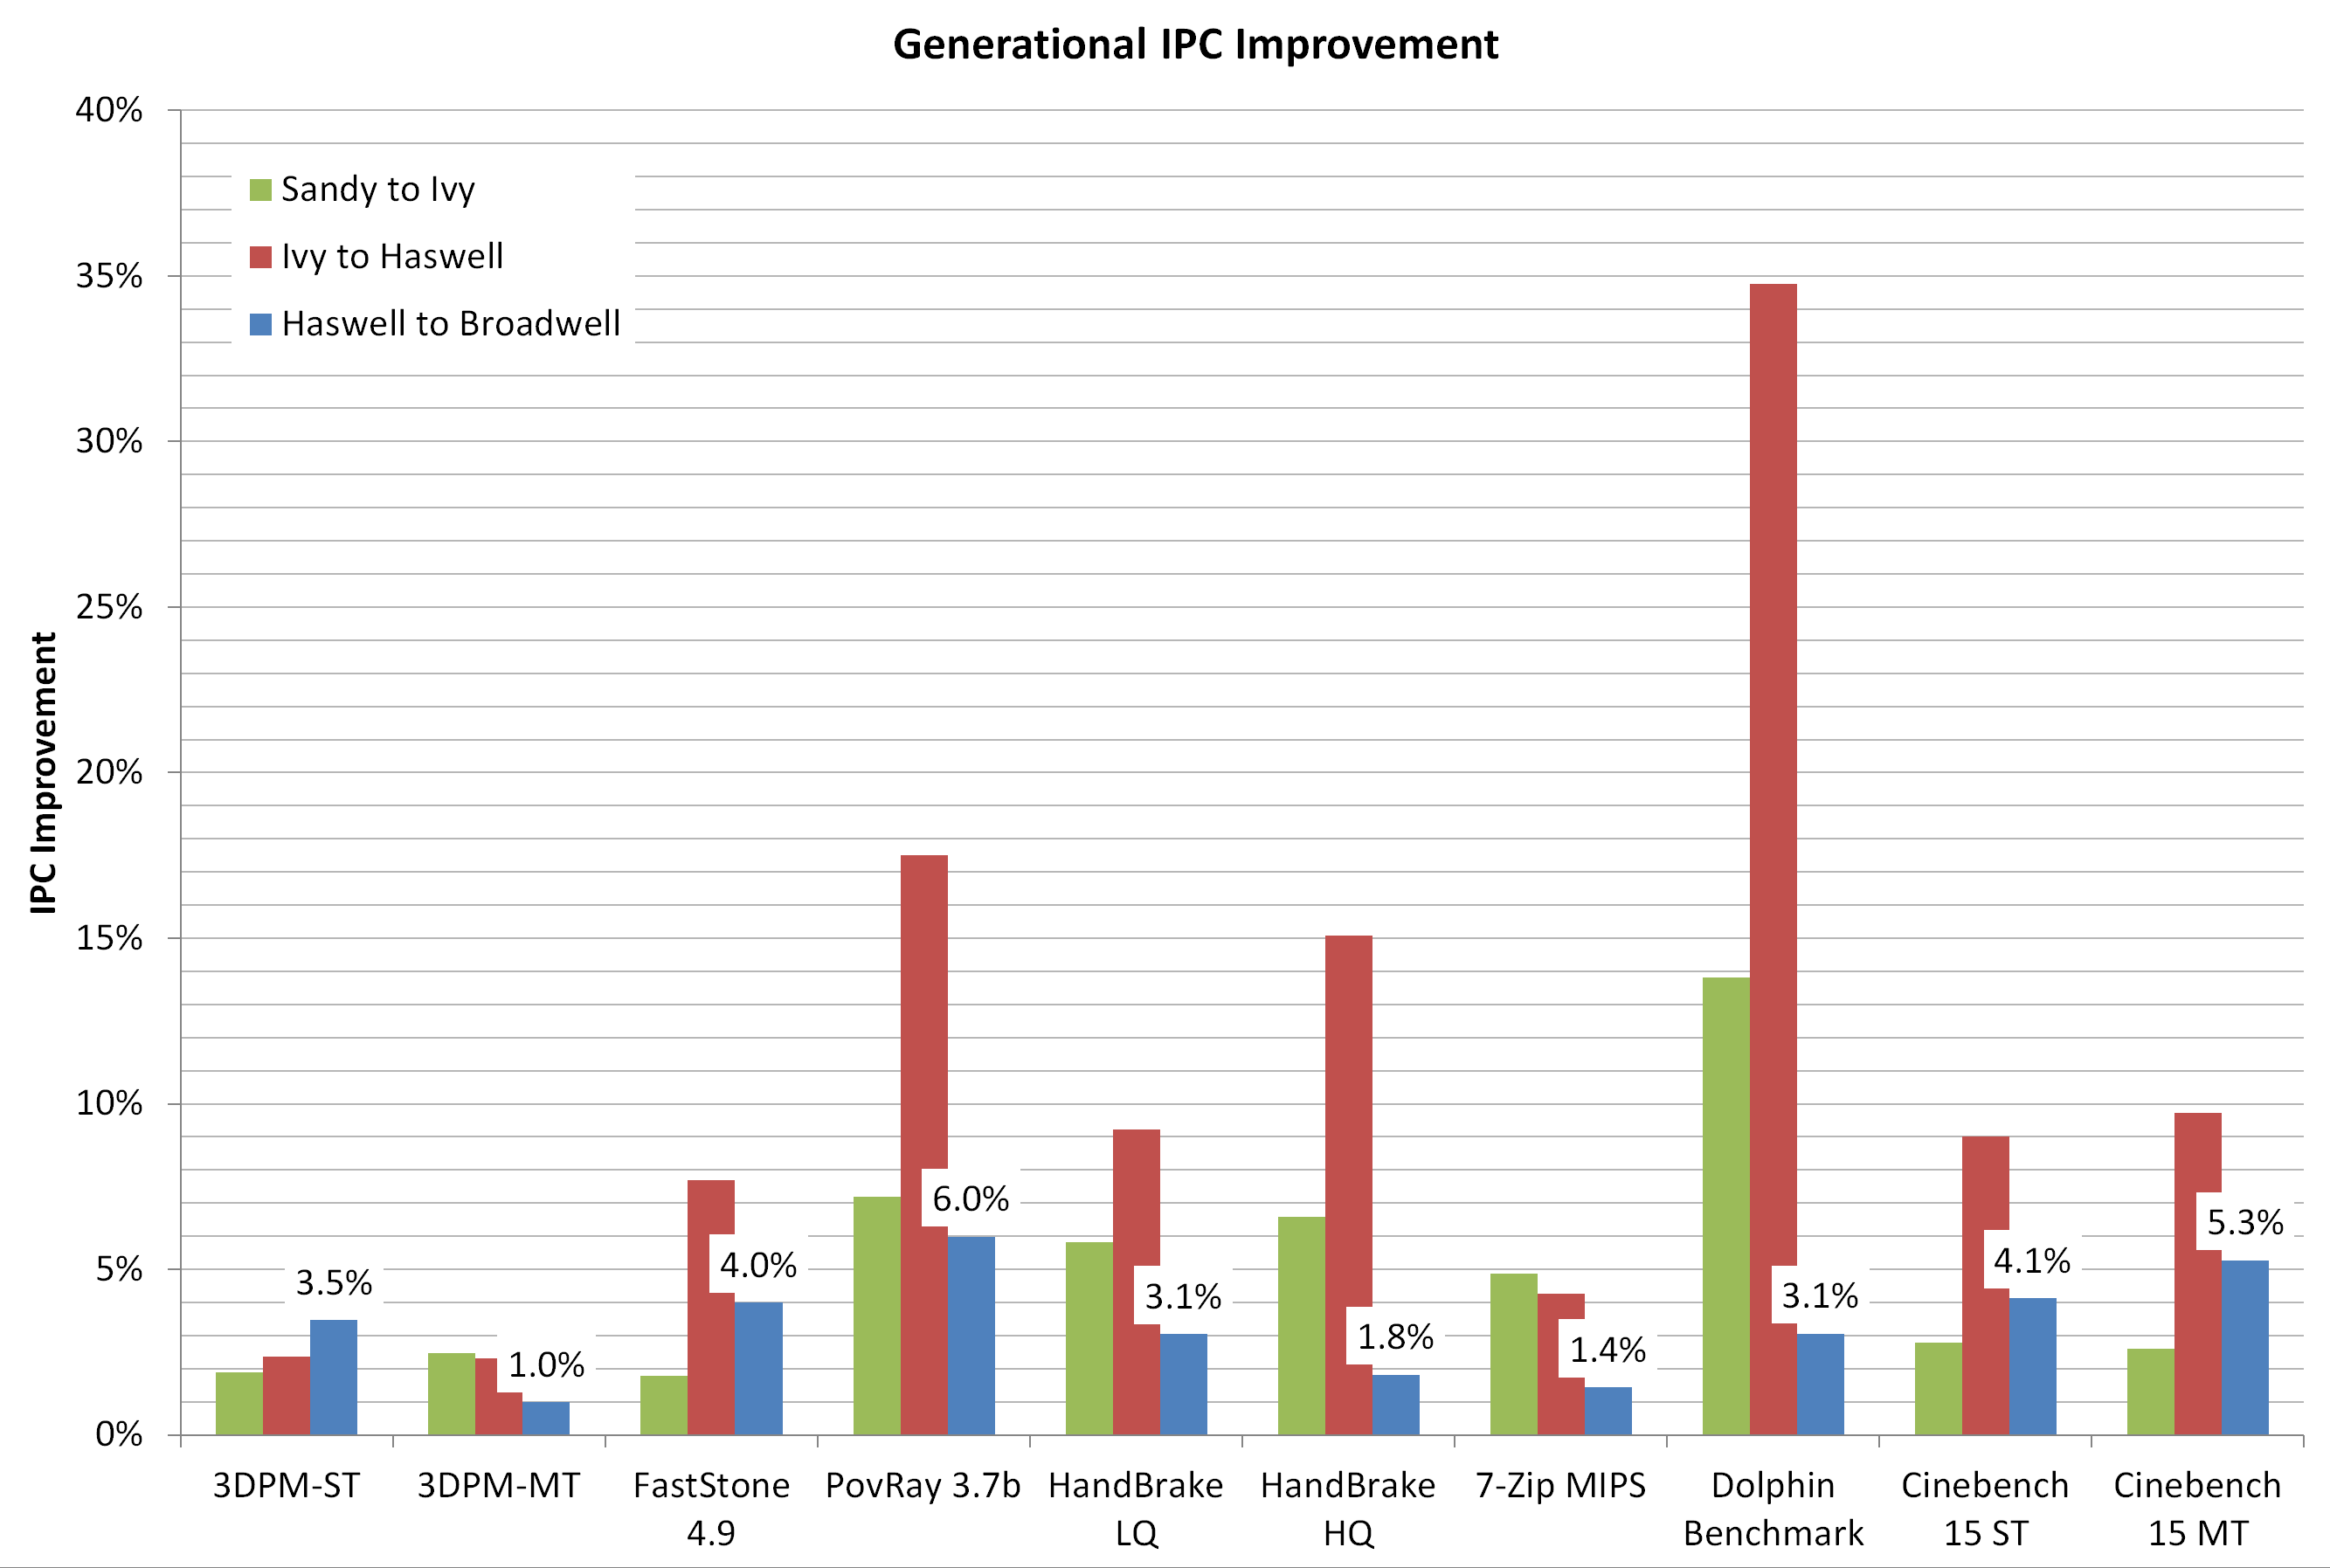
This graph shows something a little bit different. From these numbers:
Sandy Bridge to Ivy Bridge: Average ~5.0% Up
Ivy Bridge to Haswell: Average ~11.2% Up
Haswell to Broadwell: Average ~3.3% Up
Thus in a like for like environment, when eDRAM is not explicitly a driver for performance, Broadwell gives a 3.3% gain over Haswell. That’s a take home message worth considering, but it also affords the difference in performance between an architecture update and a node change.
Cycling back to our WinRAR test, things look a little different. Ivy Bridge to Haswell gives only a 3.2% difference, but the eDRAM in Broadwell slaps on another 23.8% performance increase, dropping the benchmark from 76.65 seconds to 63.91 seconds. When eDRAM counts, it counts a lot.


121 Comments
View All Comments
Shadow7037932 - Monday, August 3, 2015 - link
Still running a i7 920 @ 3.8Ghz on custom water cooling. OS, SSDs, HDDs, GPUs, have all been upgraded since 2009. Still holding it's own in gaming and multithreaded software (video rendering).Also, with the hexacore X5650 being available for around $70-100 used, I can probably breathe a bit more life into this.
milli - Tuesday, August 4, 2015 - link
I invested big time in my X58 platform but it's still going strong. One year ago I upgraded my i7 920 to a Xeon X5650 (which I bought second hand for like $100). Now I have a six core HT 32nm OC'd beast that runs much cooler than my 920. I can't believe this platform is now 7 years old.Jetpil0t - Thursday, August 6, 2015 - link
I have been waiting for so long to upgrade my 2500k an R9 290, was looking at a 6600k and Fury X but for like $2,000 the performance really isn't there. Second hand 290 for $250 will probably be my next upgrade and still faster than a brand new 6600k Fury build. More money for games I guess.michael2k - Monday, August 3, 2015 - link
Is that entirely true? It seems from the graphs that you can expect 10% to 20% improvement in performance at the same clock compared to Sandy Bridge and the Broadwell is a good 30% less in terms of power consumption. In other words the 0.25V difference in overclock is exactly the reason Broadwell consumes 30% less power. Since you don't care about the power then you can clock it up and volt it up and see a 10% to 20% improvement in performance. You can argue that the 10% to 20% improvement isn't worth it, of course. The IPC gains only matter if you care to overclock the Broadwell part.sonny73n - Tuesday, August 4, 2015 - link
"my ivy bridge 3570k does the same clock with 1.075v."1.075v @4.2GHz? Are you sure you didn't mistype? Prime95 stress test?
Jetpil0t - Thursday, August 6, 2015 - link
Still rocking a i5 2500k @ 4.0Ghz and an R9 290 @ 1.1Ghz and it's rockin along no problem, I want to but new shiny things, but there is zero reason to, which is nice for the value but a little odd given the age of this processor. If I had known I was going to be hanging onto this CPU for so long I would have picked up the i7 2600/2700k, but even then, the i5 2500k is a powerhouse, apparently. Just puts into perspective how crazy powerful these CPUs were 5 years ago when they landed.Jetpil0t - Thursday, August 6, 2015 - link
They should just take each of these CPUs to 4.0Ghz locked and bench it out, I bet the 2600k still fires up there with the best of them. The sample used here is still stock, so with an OC it's more or less up there all the way through to a 980ti.Oxford Guy - Thursday, January 21, 2016 - link
Proper Broadwell overclocking appears to require that the EDRAM clock be changed. They didn't do that here, hence the poor result.K_Space - Monday, August 3, 2015 - link
For desktop users the article only consolidated what was already known: hold tight to your Haswell CPU until Skylake (and even then you probably won't need to upgrade). The Z97 chipset is such a mature platform and the high frequency clocked parts have dropped in price. The 4790K is an absolute brute. Haswell -just like Sandy and Nehalem is going to be very stretchy generation.Nagorak - Tuesday, August 4, 2015 - link
Forget that, just hold tight to your Sandy Bridge. Four years running and you can make up most of the difference in IPC by just cranking up the clock. Once you take the lower frequency into account, Broadwell's ~18% improvement drops to only around 10%.