Crucial BX100 (120GB, 250GB, 500GB & 1TB) SSD Review
by Kristian Vättö on April 10, 2015 1:20 PM EST- Posted in
- Storage
- SSDs
- Crucial
- Micron
- Silicon Motion
- BX100
- SM2246EN
- Micron 16nm
Performance Consistency
We've been looking at performance consistency since the Intel SSD DC S3700 review in late 2012 and it has become one of the cornerstones of our SSD reviews. Back in the days many SSD vendors were only focusing on high peak performance, which unfortunately came at the cost of sustained performance. In other words, the drives would push high IOPS in certain synthetic scenarios to provide nice marketing numbers, but as soon as you pushed the drive for more than a few minutes you could easily run into hiccups caused by poor performance consistency.
Once we started exploring IO consistency, nearly all SSD manufacturers made a move to improve consistency and for the 2015 suite, I haven't made any significant changes to the methodology we use to test IO consistency. The biggest change is the move from VDBench to Iometer 1.1.0 as the benchmarking software and I've also extended the test from 2000 seconds to a full hour to ensure that all drives hit steady-state during the test.
For better readability, I now provide bar graphs with the first one being an average IOPS of the last 400 seconds and the second graph displaying the IOPS divided by standard deviation during the same period. Average IOPS provides a quick look into overall performance, but it can easily hide bad consistency, so looking at standard deviation is necessary for a complete look into consistency.
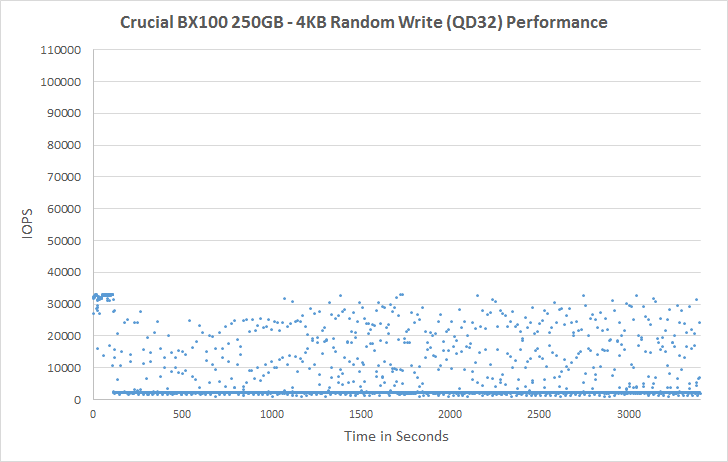
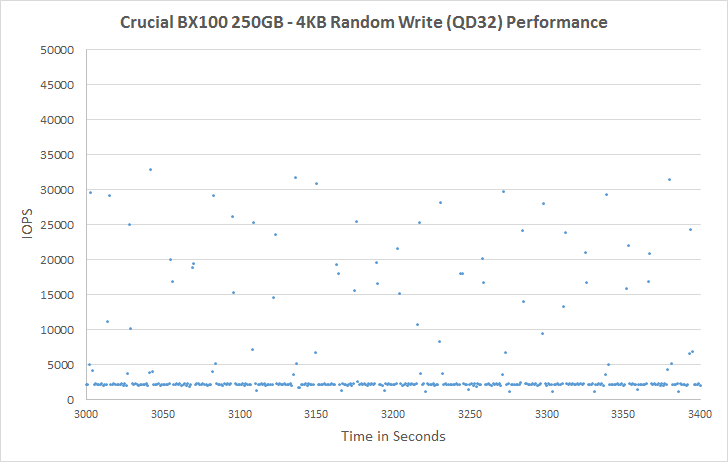
I'm still providing the same scatter graphs too, of course. However, I decided to dump the logarithmic graphs and go linear-only since logarithmic graphs aren't as accurate and can be hard to interpret for those who aren't familiar with them. I provide two graphs: one that includes the whole duration of the test and another that focuses on the last 400 seconds of the test to get a better scope into steady-state performance.
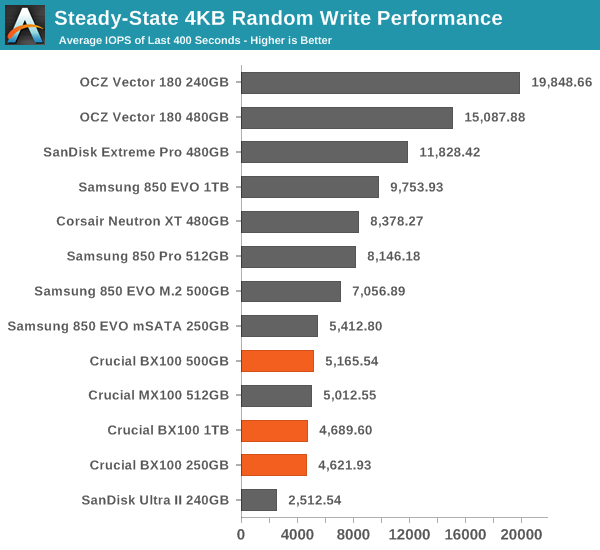
Steady-state performance has never been Crucial's nor Silicon Motion's biggest strength, but 5K IOPS is fairly average for a value-oriented SSD and for the target group the performance is just fine.
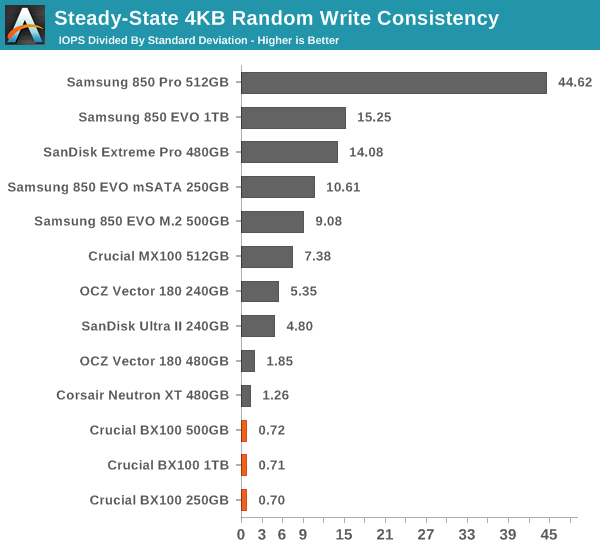
As some of you have mentioned in the comments, displaying standard deviation alone isn't very useful because it totally ignores the IOPS, so I've changed the graph to IOPS divided by standard deviation during the last 400 seconds of the run. The SM2246EN has always been very inconsistent and it appears that the BX100 is no exception since it has the worst consistency we've tested so far.
 |
|||||||||
| Default | |||||||||
| 25% Over-Provisioning | |||||||||
Putting the IOPS under a microscope shows that the consistency really is poor. That's nothing new to the SM2246EN and the graph is very similar to the other SM2246EN drives we have tested, although I was hoping that Crucial would have tuned the firmware for better consistency. On the other hand, the users buying the BX100 are unlikely to put the drive under harsh 4KB random write workloads, so all in all the consistency isn't much of an issue.
 |
|||||||||
| Default | |||||||||
| 25% Over-Provisioning | |||||||||


67 Comments
View All Comments
mczak - Monday, April 13, 2015 - link
Note though the M500, M550 and MX100 all suffer from a very serious issue wrt queued trim (possibly related to link power management). It is imho far more serious than the 840 EVO issues as it kills your data, but much fewer people are affected by it (only these using linux and of those most won't ever see it because the kernel was patched to blacklist the feature). This problem which was known for one and a half year or so is now finally acknowledged and fixed in firmware for the M550 and MX100 (still unfixed on the M500 where it was discovered, the MX200 had it fixed from start and the BX100 doesn't support queued trim in the first place apparently and has a different controller anyway).That does not exactly inspire confidence - Crucial claiming "hard to reproduce" or something along these lines, because apparently both Windows and Mac OS only use non-queued variant of trim (well I don't know for sure about Mac OS because this one doesn't use trim at all by default for non-apple built ssds), but it was very easy to produce failures with linux.
If windows were to support queued trim tomorrow you'd see return rates soar to levels never seen before... (or probably not, because if that would be enabled now surely the feature would be blacklisted for these drives too).
Not saying queued trim is an essential feature (it's clearly not), but if Crucial wasn't willing to actually test it with the only OS which supports it they probably shouldn't have enabled it in the first place...
I have to say though this is not really enough to steer me away from Crucial SSDs (they indeed provide very good value overall), but keep that in mind if you think Samsung are the only ones with Firmware issues.
FunBunny2 - Thursday, April 16, 2015 - link
Since AT went into the OCZ madness, back then, how about some investigation into this new firmware? From following the comments, it's something of a clusterfluff.GregGritton - Monday, April 13, 2015 - link
I hope that Anandtech returns to posting the log-based I/O consistency graphs.What you really want in the graph is an indication of how likely and severe of slowdowns you will experience, which means you want to graph the time per I/O operation (averaged over a short period like a second) rather than the number of I/O operations per second. Then, any outliers have significance. This means all of the useful information in the ops/second graphs are scrunched down at the bottom, where it is hard to see what the actual value is. (For example, the Crucial BX seems to generally have 2000 I/O ops/second, but it is hard to tell as the first line on the 1st graph is 10,000, and 5,000 on the 2nd.)
The logarithmic graphs spread out the lower I/O ops/second values enough so that you could tell farily easily where there lower values were. Thus, they were a good compromise between a ops/second graph and a (milli/micro)seconds/op graph.
jamesnieves - Monday, April 13, 2015 - link
my Aunty Isabella recently got a superb Dodge Challenger SRT8 by working part time off of a macbook air.workripple.com
Laststop311 - Monday, April 13, 2015 - link
Well if you want to put an ssd in your laptop this is the drive to get.soccerharms - Tuesday, April 14, 2015 - link
The 850 EVO just dropped to 179 for the 500GB on amazon with the bx100 at 187. I will be using this in a laptop. What does everyone think?CknSalad - Tuesday, April 14, 2015 - link
Samsung 850 Pro 256GB is $130 on Ebay just today! Just ordered mine!JackF - Wednesday, April 15, 2015 - link
I was surprised that the Mushkin Reactor 1T was not in the table comparisons. It was just reviewed by Kristian back in February and received an Anandtech Recommendation. It looks to me to fin right in this performance category and they have been running the 1T versions at $339.After deliberating, I just upgraded to a Samsung 850 EVO 1TB (at $350). It is a noticeable upgrade from my older Crucial M4 256GB.
Walkeer - Friday, April 17, 2015 - link
perhaps I am blind, but the Samsung EVO seems either more power efficient or equal compared to BX100 from the idle power consumption graph, is that correct? That invalidates the final words.leexgx - Monday, April 20, 2015 - link
The bx100 is the most power efficient ssd at this time (I have the bx100 120gb soon)Only interesting thing here was devsleep used or was this just slumber (dipm+hipm only)