Samsung SM951 (512GB) PCIe SSD Review
by Kristian Vättö on February 24, 2015 8:00 AM ESTAnandTech Storage Bench - Light
The Light trace is designed to be an accurate illustration of basic usage. It's basically a subset of the Heavy trace, but we've left out some workloads to reduce the writes and make it more read intensive in general.
| AnandTech Storage Bench - Light - Specs | ||||||||||||
| Reads | 372,630 | |||||||||||
| Writes | 459,709 | |||||||||||
| Total IO Operations | 832,339 | |||||||||||
| Total GB Read | 17.97 GB | |||||||||||
| Total GB Written | 23.25 GB | |||||||||||
| Average Queue Depth | ~4.6 | |||||||||||
| Focus | Basic, light IO usage | |||||||||||
The Light trace still has more writes than reads, but a very light workload would be even more read-centric (think web browsing, document editing, etc). It has about 23GB of writes, which would account for roughly two or three days of average usage (i.e. 7-11GB per day).
| AnandTech Storage Bench - Light - IO Breakdown | |||||||||||
| IO Size | <4KB | 4KB | 8KB | 16KB | 32KB | 64KB | 128KB | ||||
| % of Total | 6.2% | 27.6% | 2.4% | 8.0% | 6.5% | 4.8% | 26.4% | ||||
The IO distribution of the Light trace is very similar to the Heavy trace with slightly more IOs being 128KB. About 70% of the IOs are sequential, though, so that is a major difference compared to the Heavy trace.
| AnandTech Storage Bench - Light - QD Breakdown | ||||||||||||
| Queue Depth | 1 | 2 | 3 | 4-5 | 6-10 | 11-20 | 21-32 | >32 | ||||
| % of Total | 73.4% | 16.8% | 2.6% | 2.3% | 3.1% | 1.5% | 0.2% | 0.2% | ||||
Over 90% of the IOs have a queue depth of one or two, which further proves the importance of low queue depth performance.
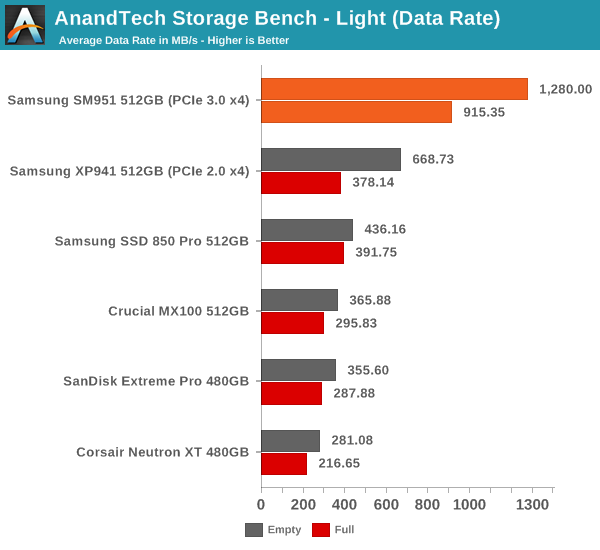
The SM951 yet again provides roughly twice the data rate compared to the XP941 and with a full drive the difference is even more significant.
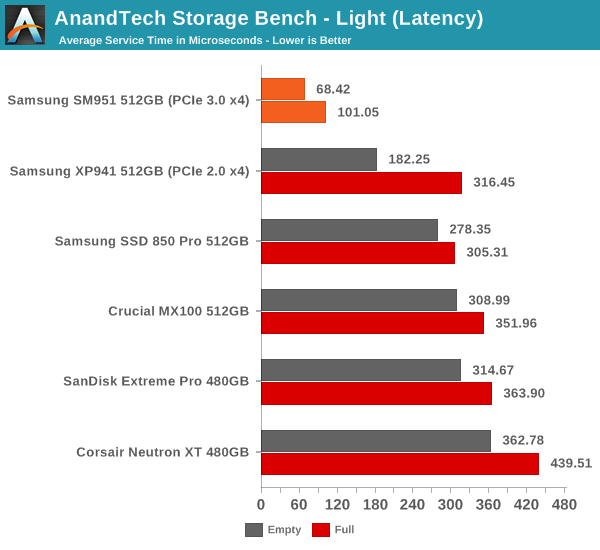
The same goes for average latency where the SM951's score is about one third of the XP941's. The SM951 can without a doubt boost performance with lighter IO loads as well, although in very light workloads the bottleneck tends to be the speed of user input (think about document creation for instance).


128 Comments
View All Comments
Makaveli - Tuesday, February 24, 2015 - link
I would love to see two Samsung 850Pro 256GB drives in Raid 0 vs this.BPB - Wednesday, February 25, 2015 - link
I was really hoping to see this compared to a RAID 0 setup. I'm considering getting one of these or a competitor's version in 2 or 3 months, but I'm also considering just getting another Samsung SSD and creating a RAID 0 setup.Flash13 - Tuesday, February 24, 2015 - link
Why trust Samsung? I don't anymore.youtard - Tuesday, February 24, 2015 - link
hurr!icrf - Tuesday, February 24, 2015 - link
Suggestion for the graphs/charts picked from a drop down: make them all have the same scale, so when flipping between them, it's easier to compare from a visual shift. Ideally, it wouldn't be a drop down, but a set of checkboxes that would show/hide each line graph on the same chart to see more than one at once. If you're pre-rendering the charts, I understand how that would be a problem.Edgar_in_Indy - Tuesday, February 24, 2015 - link
It would be a lot easier to get excited about this drive if there were real-world numbers to look at. I find it frustrating that most hard drive reviews don't show some basic load times. You know, how long to boot windows, to load a level in a game, copy a huge file, etc.It would make it much easier to judge the relative performance of drives, and decide whether the results justify the upgrade cost.
willis936 - Wednesday, February 25, 2015 - link
While it requires more technical knowledge from the reader it actually gives a lot more useful info. Time to load windows? Is that on first boot after install? After updates? After 100 programs are installed? After 10 r/w cycles? After the drive isfiles filled? With overprovisioning? I'd personally much rather synthetic tests that cover most cases so you can extrapolate subjective performance from it. You just have to know which workloads line up with which tests.DanNeely - Wednesday, February 25, 2015 - link
Page 2 of the article, section "A Word About Storage Benches and Real World Tests".TLDR version: "Too much background IO for consistent results to be possible."
Edgar_in_Indy - Wednesday, February 25, 2015 - link
From that same section: "I know some of you have criticized our benchmarks due to the lack of real world application tests, but the unfortunate truth is that it's close to impossible to build a reliable test suite that can be executed in real time. Especially if you want to test something else than just boot and application launch times, there is simply too many tasks in the background that cannot be properly controlled to guarantee valid results. "Okay, then. So a complicated real-world test is difficult to duplicate. But why can't we at least have the simple "boot and application launch times" he referenced? And what about a large file copy, like I already mentioned? That's something most people could easily relate to. And time to compress a large group of files? Etc.
If the whole idea of an SSD is to do things faster, then it would be helpful to get a stopwatch involved in these types of review, at least a little bit!
Or if it really is "Mission Impossible" to document any real world speed improvements, then I can't help but wonder if this is kind of like people paying premiums for high-performance memory, with very little real-world return.
zodiacfml - Wednesday, February 25, 2015 - link
Why not do a benchmark of a Windows installation in a virtual machine from a RAM disk?