Samsung SM951 (512GB) PCIe SSD Review
by Kristian Vättö on February 24, 2015 8:00 AM ESTAnandTech Storage Bench - Light
The Light trace is designed to be an accurate illustration of basic usage. It's basically a subset of the Heavy trace, but we've left out some workloads to reduce the writes and make it more read intensive in general.
| AnandTech Storage Bench - Light - Specs | ||||||||||||
| Reads | 372,630 | |||||||||||
| Writes | 459,709 | |||||||||||
| Total IO Operations | 832,339 | |||||||||||
| Total GB Read | 17.97 GB | |||||||||||
| Total GB Written | 23.25 GB | |||||||||||
| Average Queue Depth | ~4.6 | |||||||||||
| Focus | Basic, light IO usage | |||||||||||
The Light trace still has more writes than reads, but a very light workload would be even more read-centric (think web browsing, document editing, etc). It has about 23GB of writes, which would account for roughly two or three days of average usage (i.e. 7-11GB per day).
| AnandTech Storage Bench - Light - IO Breakdown | |||||||||||
| IO Size | <4KB | 4KB | 8KB | 16KB | 32KB | 64KB | 128KB | ||||
| % of Total | 6.2% | 27.6% | 2.4% | 8.0% | 6.5% | 4.8% | 26.4% | ||||
The IO distribution of the Light trace is very similar to the Heavy trace with slightly more IOs being 128KB. About 70% of the IOs are sequential, though, so that is a major difference compared to the Heavy trace.
| AnandTech Storage Bench - Light - QD Breakdown | ||||||||||||
| Queue Depth | 1 | 2 | 3 | 4-5 | 6-10 | 11-20 | 21-32 | >32 | ||||
| % of Total | 73.4% | 16.8% | 2.6% | 2.3% | 3.1% | 1.5% | 0.2% | 0.2% | ||||
Over 90% of the IOs have a queue depth of one or two, which further proves the importance of low queue depth performance.
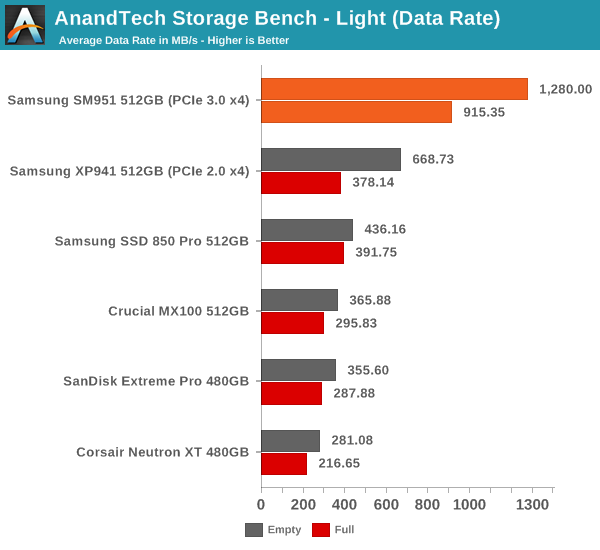
The SM951 yet again provides roughly twice the data rate compared to the XP941 and with a full drive the difference is even more significant.
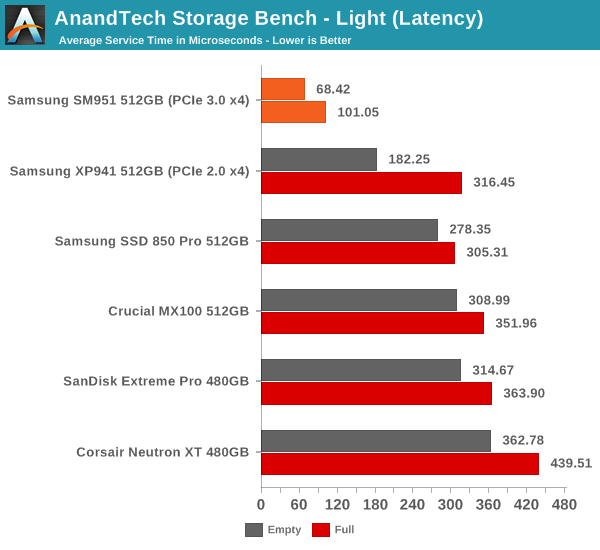
The same goes for average latency where the SM951's score is about one third of the XP941's. The SM951 can without a doubt boost performance with lighter IO loads as well, although in very light workloads the bottleneck tends to be the speed of user input (think about document creation for instance).


128 Comments
View All Comments
iLovefloss - Tuesday, February 24, 2015 - link
Samsung's first two TLC drives, the 840 and 840 EVO, has some firmware issues that cause month old data to be read slowly. The severity ranges from slower than a speedy HDD to as slow as a SATA2 SSD. Samsung's first patch didn't resolve the issue for all the 840 EVO SSDs suffering from the slowdowns or only temporarily resolved, so Samsung is in the process of making another patch.kgh00007 - Wednesday, February 25, 2015 - link
I have an 840 EVO and I applied the firmware fix in October last year and the reads have dropped again to below 50MB/s on older data, ie. my OS files and stuff that was installed when I first set the drive up.I will be waiting to see how Samsung handle this before I buy another SSD from them. Benchmarks and reviews mean nothing if an SSD drops below HDD read speeds after a few months of real world use.
Cold boot now takes minutes, not seconds!!
3DoubleD - Wednesday, February 25, 2015 - link
Exactly. I have one drive that has sequential read minimums as low as 8.8MB/s and large portions averaging 50MB/s. Another drive is fine and operates at 300MB/s consistently (although I'm pretty sure that should be higher on SATA3, but day-to-day that is fast enough not to notice). They need to squash this bug if they plan on selling TLC drives in the future in any real volume. Enthusiasts will care, which is admittedly a small market, but I think some laptop vendors might begin to take notice and avoid Samsung TLC products as well, and that's a larger market.Irish_adam - Tuesday, February 24, 2015 - link
So when are they going to make a desktop version with a heatsink on it? It seems like everyone is so obsessed with portables these days that the desktop crowed is getting ignored but surely this kind of performance would mainly be used for a desktop machine than an ultra thin laptop. Its my main gripe with PCIe SSDs atmdananski - Tuesday, February 24, 2015 - link
Same occurred to me. Could probably get a substantial boost in long-running operations by attaching a heatsink. Should be easy enough to do yourself - thermal tape and some old vram heatsinks would probably do the trick without being so heavy as to break the pcie slot.I would like to see the rate of heat dissipation after heavy use (i.e. how that temperature graph looks after you stop writing to the disk). It starts throttling after roughly 180GB sequential, which is plenty for most scenarios, but how long does it take to cool back down again for your next big write? Does throttling occur under more mixed, sustained loads like a database server? Not exactly my kind of use cases, but I'd be interested to see.
DanNeely - Tuesday, February 24, 2015 - link
"However, it's nowhere near the maximum bandwidth of the PCIe 3.0 x4 bus, though, which should be about 3.2GB/s (PCIe only has ~80% efficiency with overhead after the 128b/132b scheme used by PCIe 3.0)."Where's the 20% loss coming from? 128/132 bit encoding only has a 3% overhead, is this an incompletely updated copy/paste from a description of PCIe 2.0? The 8/10bit encoding used in the older version did have a 20% penalty.
Kristian Vättö - Tuesday, February 24, 2015 - link
That's the overhead on top of the encoding scheme and is a rough figure based on our own testing with GPU memory bandwidth that will saturate the interface.It's the same in PCIe 2.0 too: the interface is good for 5GT/s per lane, which equals 500MB/s per lane once you take the 8b/10b encoding and bits to bytes translation into account. However, in real world the best bandwidths I've seen have been about 390MB/s per lane.
extide - Tuesday, February 24, 2015 - link
Protocol overhead (NOT the 120/132b part) -- the commands and stuff, interrupt latency from the cpu and other devices, DMA latencies on read/write to main system memory, etc.Hulk - Tuesday, February 24, 2015 - link
Would it be possible to display the entire AS SSD results window?Kristian Vättö - Tuesday, February 24, 2015 - link
I only run the sequential test, but I can certainly switch to running the full test and publishing the results as a screenshot if that's preferred.