Samsung SM951 (512GB) PCIe SSD Review
by Kristian Vättö on February 24, 2015 8:00 AM ESTAnandTech Storage Bench - The Destroyer
The Destroyer has been an essential part of our SSD test suite for nearly two years now. It was crafted to provide a benchmark for very IO intensive workloads, which is where you most often notice the difference between drives. It's not necessarily the most relevant test to an average user, but for anyone with a heavier IO workload The Destroyer should do a good job at characterizing performance.
| AnandTech Storage Bench - The Destroyer | ||||||||||||
| Workload | Description | Applications Used | ||||||||||
| Photo Sync/Editing | Import images, edit, export | Adobe Photoshop CS6, Adobe Lightroom 4, Dropbox | ||||||||||
| Gaming | Download/install games, play games | Steam, Deus Ex, Skyrim, Starcraft 2, BioShock Infinite | ||||||||||
| Virtualization | Run/manage VM, use general apps inside VM | VirtualBox | ||||||||||
| General Productivity | Browse the web, manage local email, copy files, encrypt/decrypt files, backup system, download content, virus/malware scan | Chrome, IE10, Outlook, Windows 8, AxCrypt, uTorrent, AdAware | ||||||||||
| Video Playback | Copy and watch movies | Windows 8 | ||||||||||
| Application Development | Compile projects, check out code, download code samples | Visual Studio 2012 | ||||||||||
The table above describes the workloads of The Destroyer in a bit more detail. Most of the workloads are run independently in the trace, but obviously there are various operations (such as backups) in the background.
| AnandTech Storage Bench - The Destroyer - Specs | ||||||||||||
| Reads | 38.83 million | |||||||||||
| Writes | 10.98 million | |||||||||||
| Total IO Operations | 49.8 million | |||||||||||
| Total GB Read | 1583.02 GB | |||||||||||
| Total GB Written | 875.62 GB | |||||||||||
| Average Queue Depth | ~5.5 | |||||||||||
| Focus | Worst case multitasking, IO consistency | |||||||||||
The name Destroyer comes from the sheer fact that the trace contains nearly 50 million IO operations. That's enough IO operations to effectively put the drive into steady-state and give an idea of the performance in worst case multitasking scenarios. About 67% of the IOs are sequential in nature with the rest ranging from pseudo-random to fully random.
| AnandTech Storage Bench - The Destroyer - IO Breakdown | |||||||||||
| IO Size | <4KB | 4KB | 8KB | 16KB | 32KB | 64KB | 128KB | ||||
| % of Total | 6.0% | 26.2% | 3.1% | 2.4% | 1.7% | 38.4% | 18.0% | ||||
I've included a breakdown of the IOs in the table above, which accounts for 95.8% of total IOs in the trace. The leftover IO sizes are relatively rare in between sizes that don't have a significant (>1%) share on their own. Over a half of the transfers are large IOs with one fourth being 4KB in size.
| AnandTech Storage Bench - The Destroyer - QD Breakdown | ||||||||||||
| Queue Depth | 1 | 2 | 3 | 4-5 | 6-10 | 11-20 | 21-32 | >32 | ||||
| % of Total | 50.0% | 21.9% | 4.1% | 5.7% | 8.8% | 6.0% | 2.1% | 1.4 | ||||
Despite the average queue depth of 5.5, a half of the IOs happen at queue depth of one and scenarios where the queue depths is higher than 10 are rather infrequent.
The two key metrics I'm reporting haven't changed and I'll continue to report both data rate and latency because the two have slightly different focuses. Data rate measures the speed of the data transfer, so it emphasizes large IOs that simply account for a much larger share when looking at the total amount of data. Latency, on the other hand, ignores the IO size, so all IOs are given the same weight in the calculation. Both metrics are useful, although in terms of system responsiveness I think the latency is more critical. As a result, I'm also reporting two new stats that provide us a very good insight to high latency IOs by reporting the share of >10ms and >100ms IOs as a percentage of the total.
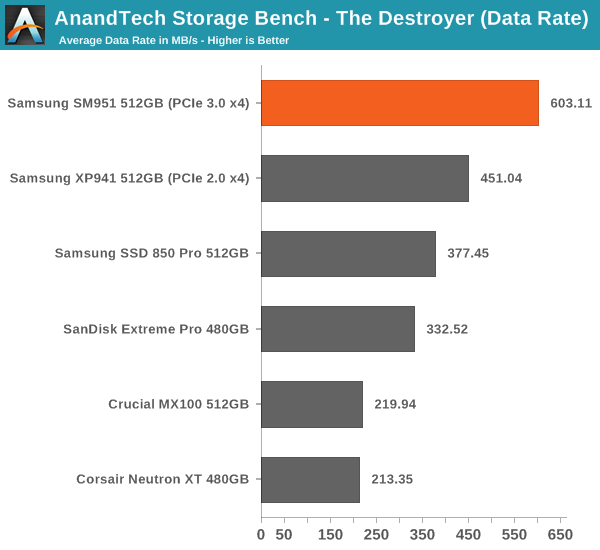
The SM951 takes the lead easily and provides ~34% increase in data rate over the XP941. The advantage over some of the slower SATA 6Gbps drives is nearly threefold, which speaks for the performance benefit that PCIe and especially PCIe 3.0 provide.
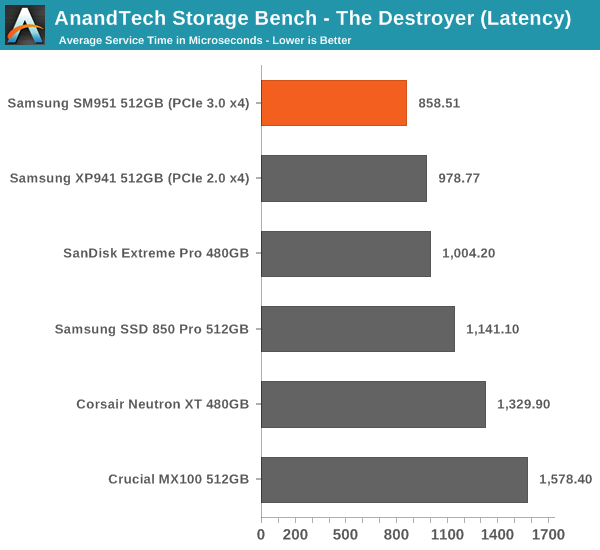
The latency benefit isn't as significant, which suggests that the SM951 provides substantial boost in large IO performance, but the performance at small IO sizes isn't dramatically better.
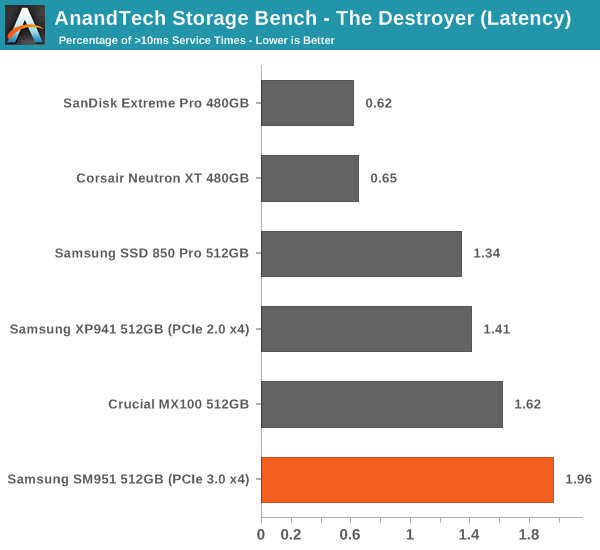
Despite the lowest average latency, the SM951 actually has the most >10ms IO with nearly 2% of the IOs having higher latency than 10ms. I did some thermal throttling testing (see the dedicated page for full results) and the SM951 seems to throttle fairly aggressively, so my hypothesis is that the high number is due to throttling, which limits the drive's throughput momentarily (and hence increases the latency) to cool down the drive.
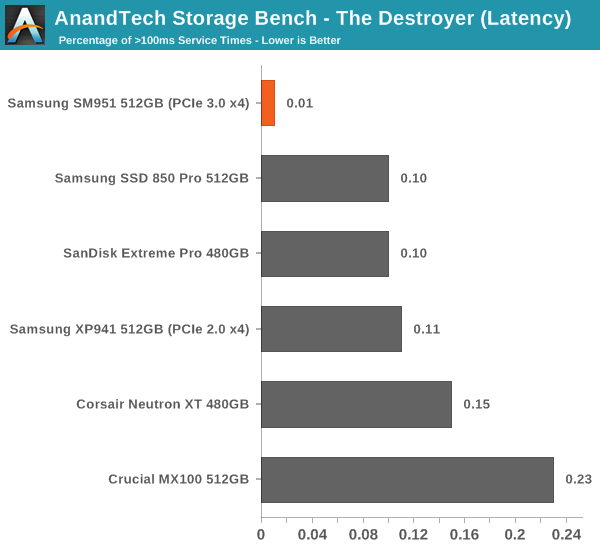
However, the SM951 has the least >100ms IOs, which means that despite the possible throttling the maximum service times stay between 10ms and 100ms.


128 Comments
View All Comments
iLovefloss - Tuesday, February 24, 2015 - link
Samsung's first two TLC drives, the 840 and 840 EVO, has some firmware issues that cause month old data to be read slowly. The severity ranges from slower than a speedy HDD to as slow as a SATA2 SSD. Samsung's first patch didn't resolve the issue for all the 840 EVO SSDs suffering from the slowdowns or only temporarily resolved, so Samsung is in the process of making another patch.kgh00007 - Wednesday, February 25, 2015 - link
I have an 840 EVO and I applied the firmware fix in October last year and the reads have dropped again to below 50MB/s on older data, ie. my OS files and stuff that was installed when I first set the drive up.I will be waiting to see how Samsung handle this before I buy another SSD from them. Benchmarks and reviews mean nothing if an SSD drops below HDD read speeds after a few months of real world use.
Cold boot now takes minutes, not seconds!!
3DoubleD - Wednesday, February 25, 2015 - link
Exactly. I have one drive that has sequential read minimums as low as 8.8MB/s and large portions averaging 50MB/s. Another drive is fine and operates at 300MB/s consistently (although I'm pretty sure that should be higher on SATA3, but day-to-day that is fast enough not to notice). They need to squash this bug if they plan on selling TLC drives in the future in any real volume. Enthusiasts will care, which is admittedly a small market, but I think some laptop vendors might begin to take notice and avoid Samsung TLC products as well, and that's a larger market.Irish_adam - Tuesday, February 24, 2015 - link
So when are they going to make a desktop version with a heatsink on it? It seems like everyone is so obsessed with portables these days that the desktop crowed is getting ignored but surely this kind of performance would mainly be used for a desktop machine than an ultra thin laptop. Its my main gripe with PCIe SSDs atmdananski - Tuesday, February 24, 2015 - link
Same occurred to me. Could probably get a substantial boost in long-running operations by attaching a heatsink. Should be easy enough to do yourself - thermal tape and some old vram heatsinks would probably do the trick without being so heavy as to break the pcie slot.I would like to see the rate of heat dissipation after heavy use (i.e. how that temperature graph looks after you stop writing to the disk). It starts throttling after roughly 180GB sequential, which is plenty for most scenarios, but how long does it take to cool back down again for your next big write? Does throttling occur under more mixed, sustained loads like a database server? Not exactly my kind of use cases, but I'd be interested to see.
DanNeely - Tuesday, February 24, 2015 - link
"However, it's nowhere near the maximum bandwidth of the PCIe 3.0 x4 bus, though, which should be about 3.2GB/s (PCIe only has ~80% efficiency with overhead after the 128b/132b scheme used by PCIe 3.0)."Where's the 20% loss coming from? 128/132 bit encoding only has a 3% overhead, is this an incompletely updated copy/paste from a description of PCIe 2.0? The 8/10bit encoding used in the older version did have a 20% penalty.
Kristian Vättö - Tuesday, February 24, 2015 - link
That's the overhead on top of the encoding scheme and is a rough figure based on our own testing with GPU memory bandwidth that will saturate the interface.It's the same in PCIe 2.0 too: the interface is good for 5GT/s per lane, which equals 500MB/s per lane once you take the 8b/10b encoding and bits to bytes translation into account. However, in real world the best bandwidths I've seen have been about 390MB/s per lane.
extide - Tuesday, February 24, 2015 - link
Protocol overhead (NOT the 120/132b part) -- the commands and stuff, interrupt latency from the cpu and other devices, DMA latencies on read/write to main system memory, etc.Hulk - Tuesday, February 24, 2015 - link
Would it be possible to display the entire AS SSD results window?Kristian Vättö - Tuesday, February 24, 2015 - link
I only run the sequential test, but I can certainly switch to running the full test and publishing the results as a screenshot if that's preferred.