Intel Haswell Low Power CPU Review: Core i3-4130T, i5-4570S and i7-4790S Tested
by Ian Cutress on December 11, 2014 10:00 AM ESTGaming Benchmarks on GTX 770
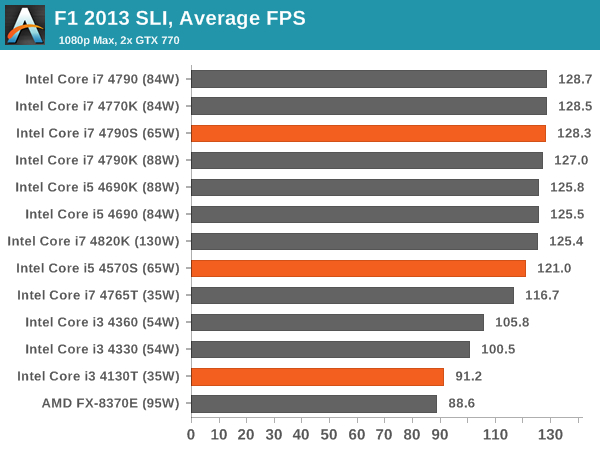
F1 2013
First up is F1 2013 by Codemasters. I am a big Formula 1 fan in my spare time, and nothing makes me happier than carving up the field in a Caterham, waving to the Red Bulls as I drive by (because I play on easy and take shortcuts). F1 2013 uses the EGO Engine, and like other Codemasters games ends up being very playable on old hardware quite easily. In order to beef up the benchmark a bit, we devised the following scenario for the benchmark mode: one lap of Spa-Francorchamps in the heavy wet, the benchmark follows Jenson Button in the McLaren who starts on the grid in 22nd place, with the field made up of 11 Williams cars, 5 Marussia and 5 Caterham in that order. This puts emphasis on the CPU to handle the AI in the wet, and allows for a good amount of overtaking during the automated benchmark. We test at 1920x1080 on Ultra graphical settings.
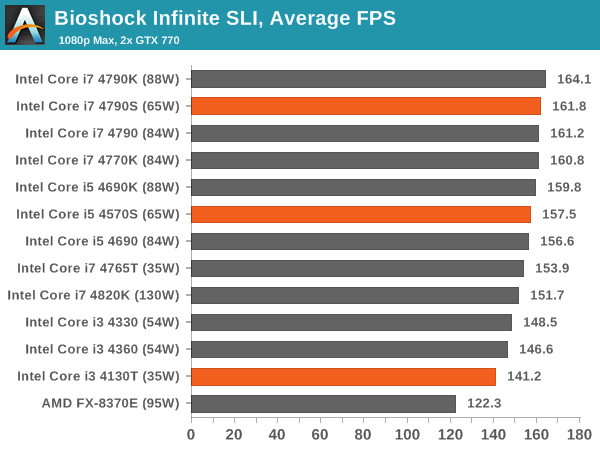
Bioshock Infinite
Bioshock Infinite was Zero Punctuation’s Game of the Year for 2013, uses the Unreal Engine 3, and is designed to scale with both cores and graphical prowess. We test the benchmark using the Adrenaline benchmark tool and the Xtreme (1920x1080, Maximum) performance setting, noting down the average frame rates and the minimum frame rates.

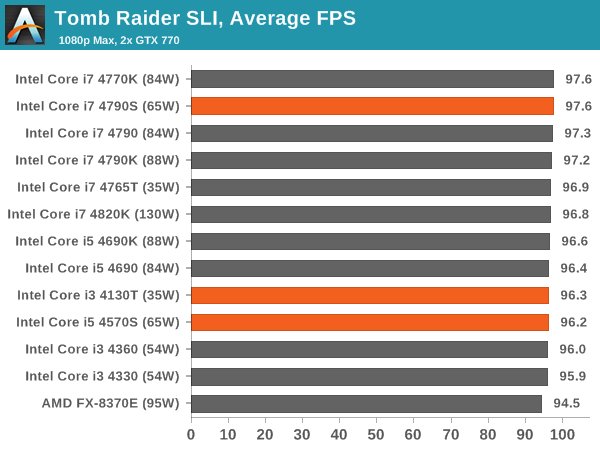
Tomb Raider
The next benchmark in our test is Tomb Raider. Tomb Raider is an AMD optimized game, lauded for its use of TressFX creating dynamic hair to increase the immersion in game. Tomb Raider uses a modified version of the Crystal Engine, and enjoys raw horsepower. We test the benchmark using the Adrenaline benchmark tool and the Xtreme (1920x1080, Maximum) performance setting, noting down the average frame rates and the minimum frame rates.

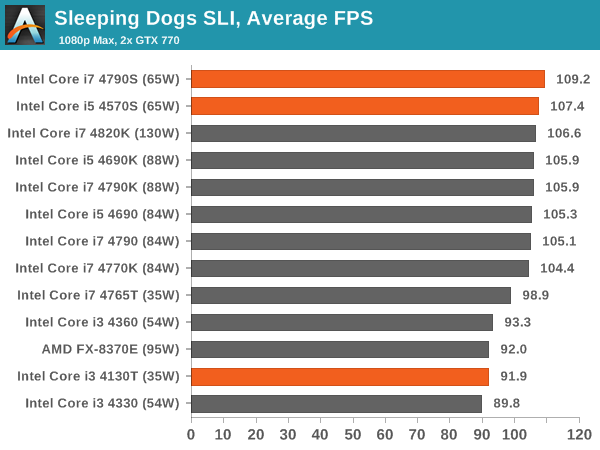
Sleeping Dogs
Sleeping Dogs is a benchmarking wet dream – a highly complex benchmark that can bring the toughest setup and high resolutions down into single figures. Having an extreme SSAO setting can do that, but at the right settings Sleeping Dogs is highly playable and enjoyable. We run the basic benchmark program laid out in the Adrenaline benchmark tool, and the Xtreme (1920x1080, Maximum) performance setting, noting down the average frame rates and the minimum frame rates.

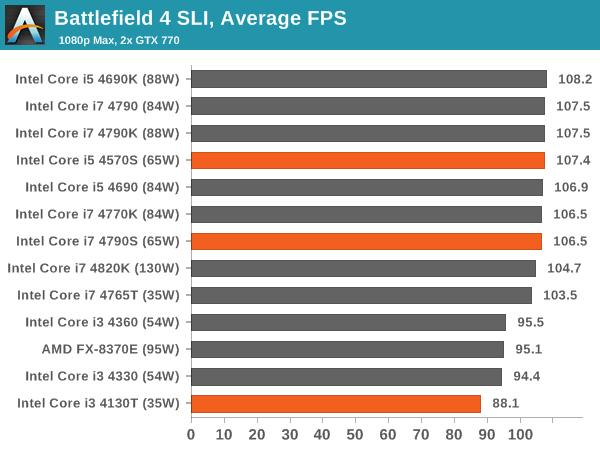
Battlefield 4
The EA/DICE series that has taken countless hours of my life away is back for another iteration, using the Frostbite 3 engine. AMD is also piling its resources into BF4 with the new Mantle API for developers, designed to cut the time required for the CPU to dispatch commands to the graphical sub-system. For our test we use the in-game benchmarking tools and record the frame time for the first ~70 seconds of the Tashgar single player mission, which is an on-rails generation of and rendering of objects and textures. We test at 1920x1080 at Ultra settings.


76 Comments
View All Comments
MrSpadge - Thursday, December 11, 2014 - link
> lower power cpus, saves us time from undervolting and just draws less power from day one.That's not the same. Low power CPUs limit your clock sped when you need it most, i.e. under full load. Whereas undervolting delivers full performance, or in TDP limited cases even higher performance. It does cut into the OC headroom, though.
xeizo - Thursday, December 11, 2014 - link
I expressed it badly, sorry. The point is as these cpus are TDP-limited you know how much they will draw the most, and can design cooling/case etc. based on that, and in "99%" of home user cases you don't need the extra performance of 4xfull load+OC without restraints - the cpu is fast during "normal" use. Even gaming. It's not the best buy for a pure rendering box or similar though ...xeizo - Thursday, December 11, 2014 - link
Btw, I noticed at a customer they had replaced all the workstations with mini-ITX HP:s, running 4570S and having SSD:s. They felt very snappy.azazel1024 - Thursday, December 11, 2014 - link
It would be nice to see what the idle power consumption is with like setups on some of the processors. In addition it is a shame that you have dV for power consumption for the Pentium models...but there are NO performance benchmarks for them. Both of the Haswell pentiums have roughly the same power consumption of the i3-4130t, but no idea what they actually can put up in terms of performance. Also rather suprised that the older Ivy Bridge i3 has such low power consumption, but seems to average slightly better than the i3-4130t.Too bad no test of the 4MB cache and higher clocked Hasy i3-ts. That would have been interesting, as that is almost exactly what I am thinking of replacing my G1610 server with. Though realistically by the time I get around to it, I'll probably be looking at a Broadwell based server.
piasabird - Thursday, December 11, 2014 - link
A lot of the 35 watt i3 CPU's are not available for sale anywhere. Especially the Haswell with the 4 meg cache and the 4600 graphics. One question I would pose is cant you just buy a regular i3 and just underclock it to use less power?MrSpadge - Thursday, December 11, 2014 - link
Yes. XBitLabs tested exactly that and the result is the same as the S/T models. The automatic voltage-frequency scaling of Turbo does all the magic behind the scenes (i.e. lowers the voltage when you lower the clock).sireangelus - Thursday, December 11, 2014 - link
Could we have mixed amd/intel linux test? it's very interesting to see since the compilers optimize more fairly.XZerg - Thursday, December 11, 2014 - link
Ian, man - seriously you need to stop these retarded Delta charts! They are useless! To make these even worse is that you are testing low wattage cpus. the people interested in such cpus are usually interested in idle and load numbers separately. what you have has no reference point to workout either the idle or load numbers.quit with these useless charts. there are many who have agreed to this.
sweetie peach - Thursday, December 11, 2014 - link
Agreed. Also the idle and load voltages would have been helpful.BrokenCrayons - Thursday, December 11, 2014 - link
I like the review, but I agree with this. I think readers would understand that their individual results are going to be different because they won't be running identical configurations, but we can do the simple subtraction ourselves if we want to see the difference in load versus idle. I'd much prefer getting the total system wattage at idle and load from a review. It seems more useful to me to see those raw numbers actually posted.