SanDisk Extreme PRO USB 3.0 Flash Drive Capsule Review
by Ganesh T S on November 27, 2014 7:00 PM EST- Posted in
- Storage
- USB 3.0
- Flash Drive
- SanDisk
Storage Benchmarks
Synthetic Benchmarks - ATTO and Crystal DiskMark
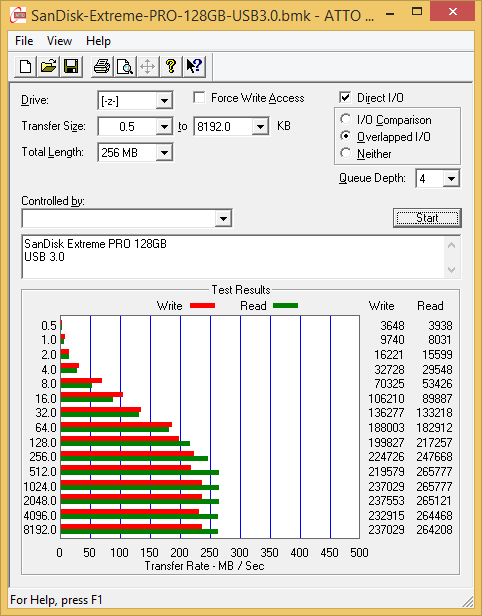
SanDisk claims read/write speeds of 245 MBps/190 MBps and 260 MBps/240 MBps respectively for the Extreme and Extreme PRO. These are backed up by the ATTO benchmarks provided below. Unfortunately, these access traces are not very common in real-life scenarios.
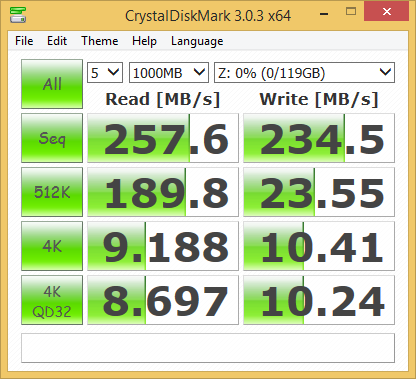
CrystalDiskMark, despite being a canned benchmark, provides a better estimate of the performance range with a selected set of numbers. As evident from the screenshot below, the performance can dip to as low as 8.7 MBps for 4K read accesses at QD32. However, these types of accesses are not common for the large size file transfers that form the primary use-case for the Extreme and Extreme PRO.
Real-Life Benchmarks - robocopy and PCMark 8 Storage Bench
Our testing methodology for DAS units also takes into consideration the usual use-case for such devices. The most common usage scenario is transfer of large amounts of photos and videos to and from the unit. The minor usage scenario is importing files directly off the DAS into a multimedia editing program such as Adobe Photoshop.
In order to tackle the first use-case, we created three test folders with the following characteristics:
- Photos: 15.6 GB collection of 4320 photos (RAW as well as JPEGs) in 61 sub-folders
- Videos: 16.1 GB collection of 244 videos (MP4 as well as MOVs) in 6 sub-folders
- BR: 10.7 GB Blu-ray folder structure of the IDT Benchmark Blu-ray (the same that we use in our robocopy tests for NAS systems)
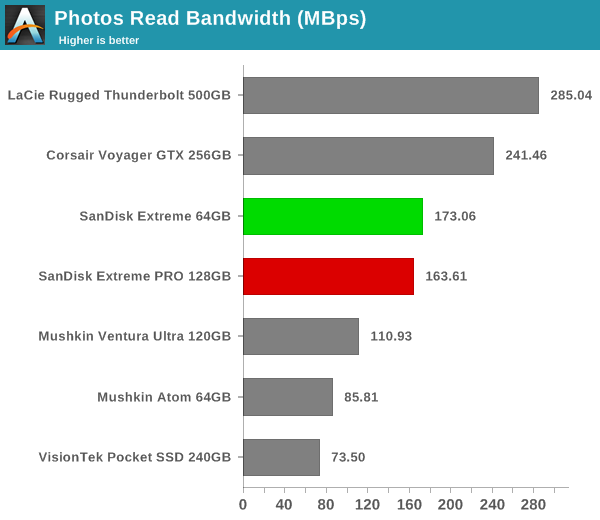
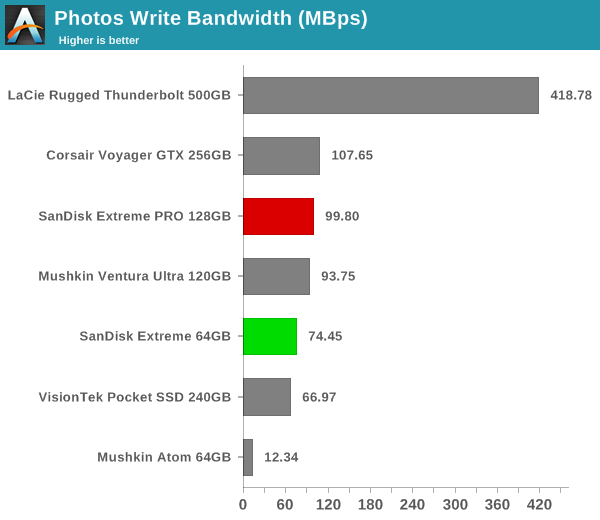
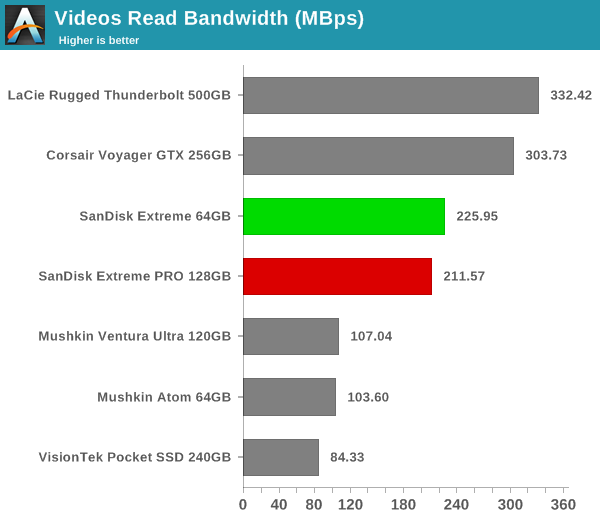
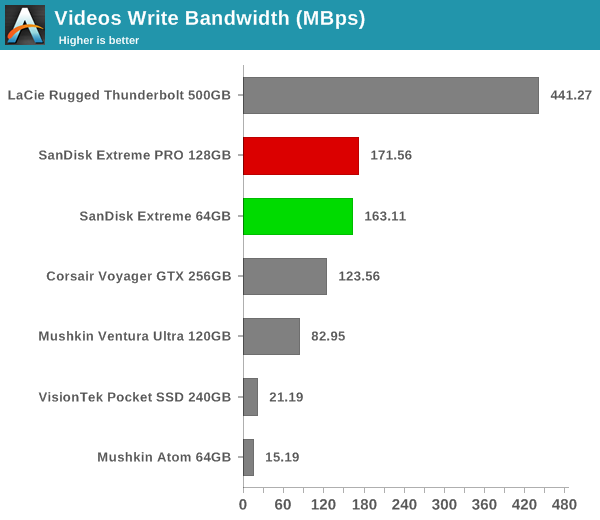
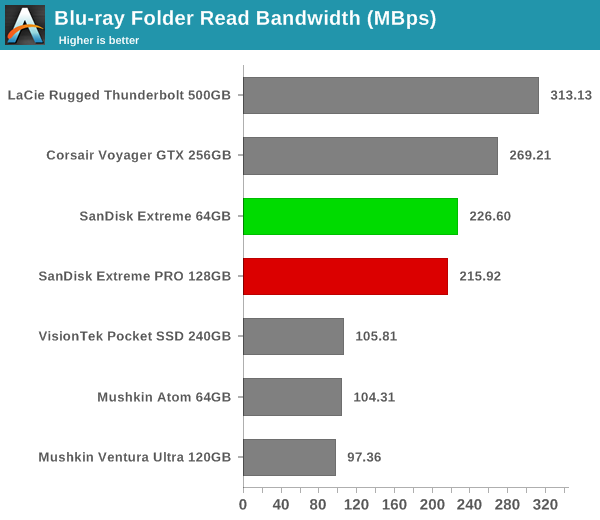
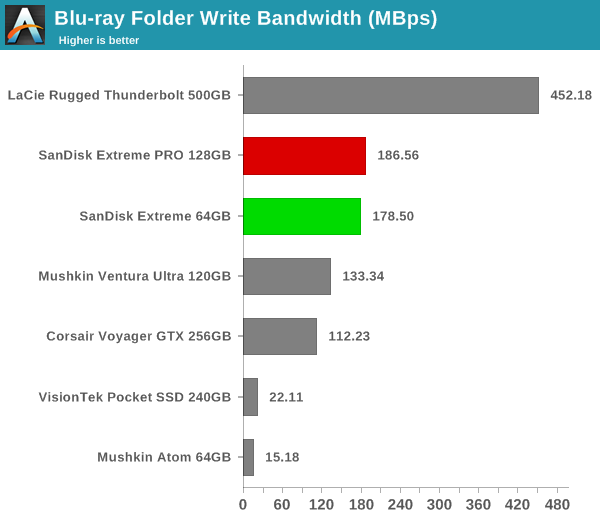
The general trend we observed was that the SanDisk Extreme was better at read benchmarks (though the Extreme PRO was quite close). When it came to the writes, the Extreme PRO pulled ahead (sometimes by as much as 25 MBps for lots of small files).
For the second use-case, we take advantage of PC Mark 8's storage bench. The storage workload involves games as well as multimedia editing applications. The command line version allows us to cherry-pick storage traces to run on a target drive. We chose the following traces.
- Adobe Photoshop (Light)
- Adobe Photoshop (Heavy)
- Adobe After Effects
- Adobe Illustrator
Usually, PC Mark 8 reports time to complete the trace, but the detailed log report has the read and write bandwidth figures which we present in our performance graphs. Note that the bandwidth number reported in the results don't involve idle time compression. Results might appear low, but that is part of the workload characteristic. Note that the same testbed is being used for all DAS units. Therefore, comparing the numbers for each trace should be possible across different DAS units.
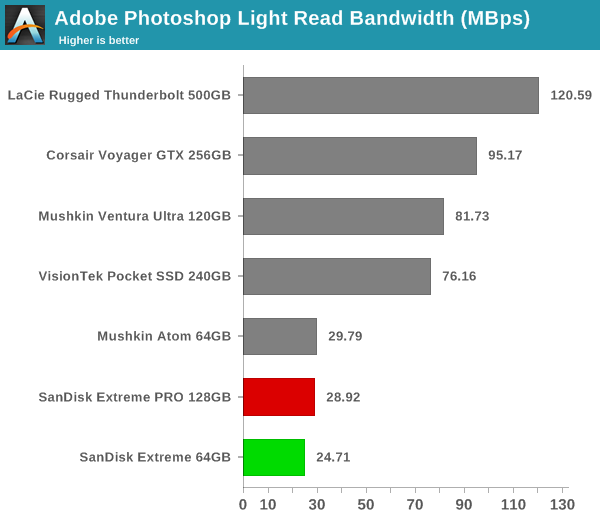
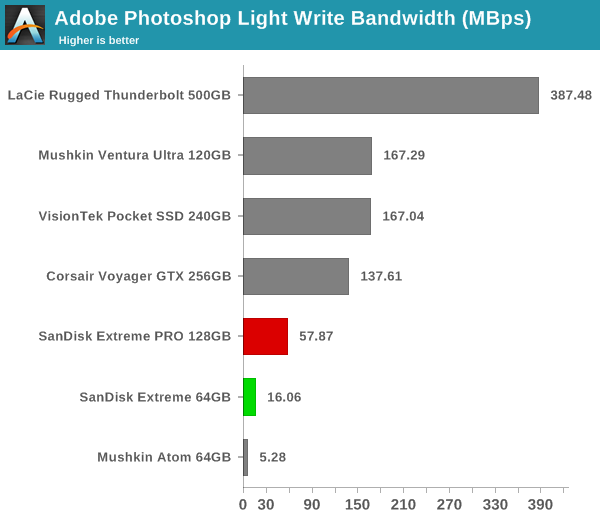
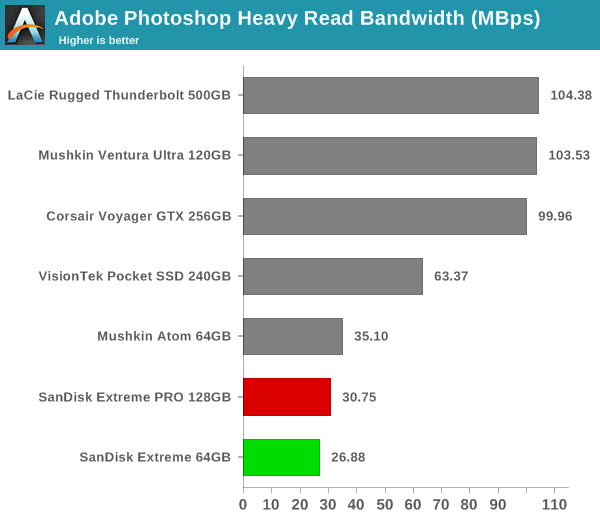
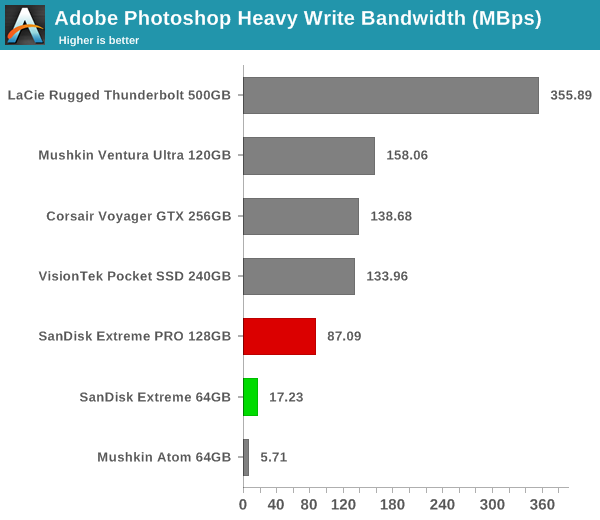
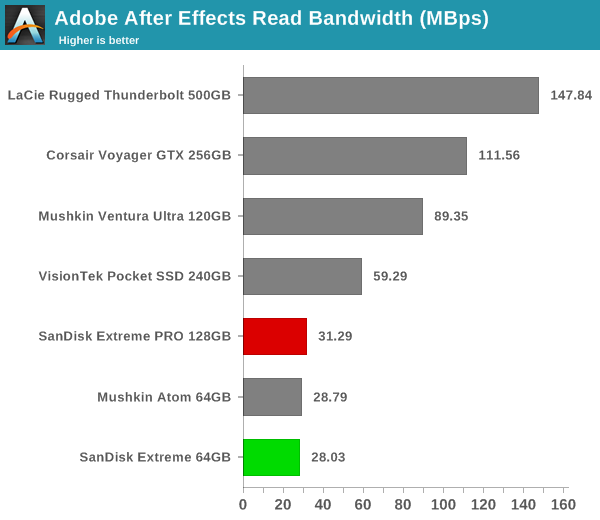
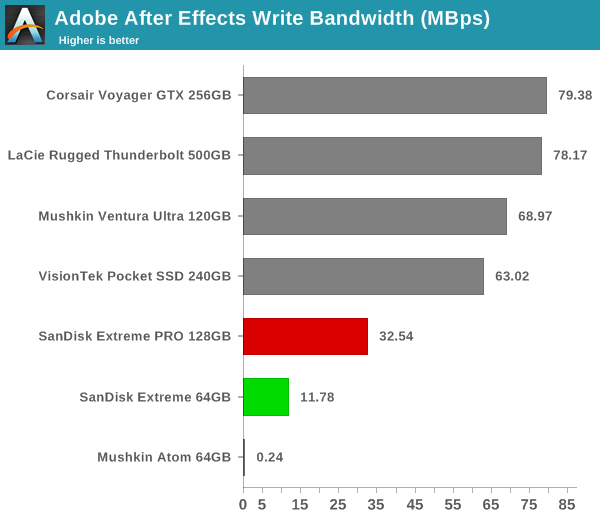
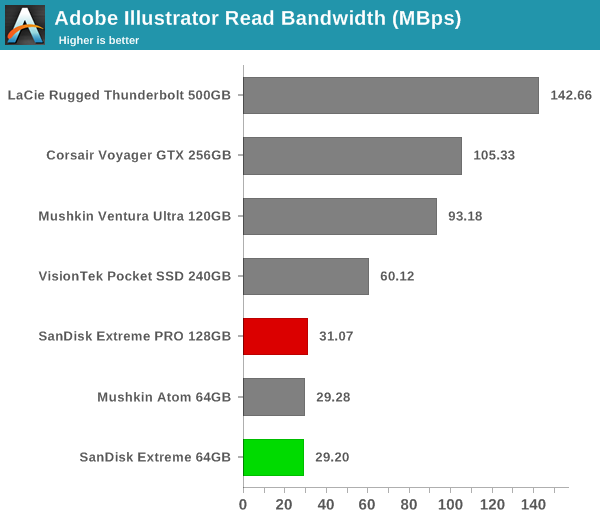
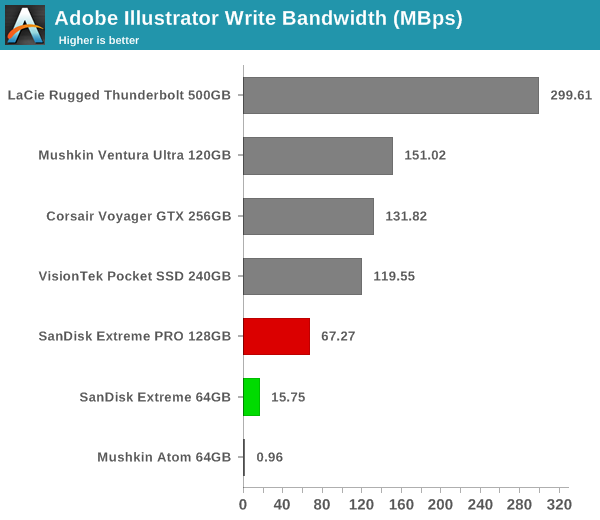
The workload traces from PCMark 8's storage bench are meant to evaluate SSDs (which is the reason the drives based on SSD controllers give great results). The firmwares in the SanDisk units being evaluated today are not optimized for these types of accesses. We wouldn't read much into the standings of the SanDisk units in the above graphs, except for the fact that one shouldn't try editing multimedia files directly off them.


31 Comments
View All Comments
thousandbuckle - Thursday, October 19, 2017 - link
What program did you use to capture the temperature of the flash drive.