Samsung SSD 850 EVO (120GB, 250GB, 500GB & 1TB) Review
by Kristian Vättö on December 8, 2014 10:00 AM ESTAnandTech Storage Bench 2013
Our Storage Bench 2013 focuses on worst-case multitasking and IO consistency. Similar to our earlier Storage Benches, the test is still application trace based – we record all IO requests made to a test system and play them back on the drive we are testing and run statistical analysis on the drive's responses. There are 49.8 million IO operations in total with 1583.0GB of reads and 875.6GB of writes. I'm not including the full description of the test for better readability, so make sure to read our Storage Bench 2013 introduction for the full details.
| AnandTech Storage Bench 2013 - The Destroyer | ||
| Workload | Description | Applications Used |
| Photo Sync/Editing | Import images, edit, export | Adobe Photoshop CS6, Adobe Lightroom 4, Dropbox |
| Gaming | Download/install games, play games | Steam, Deus Ex, Skyrim, Starcraft 2, BioShock Infinite |
| Virtualization | Run/manage VM, use general apps inside VM | VirtualBox |
| General Productivity | Browse the web, manage local email, copy files, encrypt/decrypt files, backup system, download content, virus/malware scan | Chrome, IE10, Outlook, Windows 8, AxCrypt, uTorrent, AdAware |
| Video Playback | Copy and watch movies | Windows 8 |
| Application Development | Compile projects, check out code, download code samples | Visual Studio 2012 |
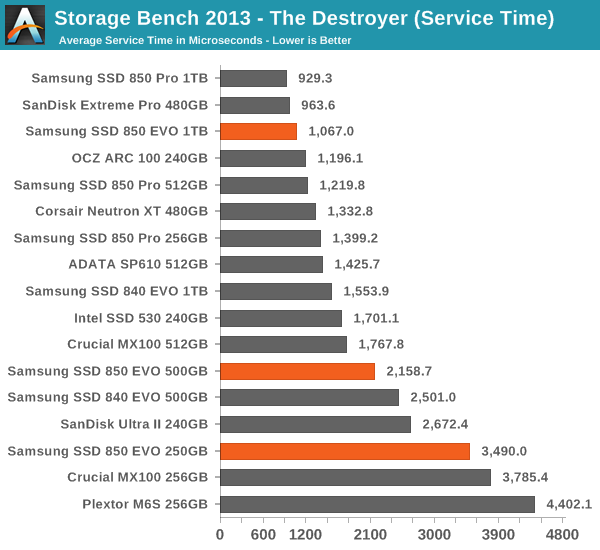
We are reporting two primary metrics with the Destroyer: average data rate in MB/s and average service time in microseconds. The former gives you an idea of the throughput of the drive during the time that it was running the test workload. This can be a very good indication of overall performance. What average data rate doesn't do a good job of is taking into account response time of very bursty (read: high queue depth) IO. By reporting average service time we heavily weigh latency for queued IOs. You'll note that this is a metric we have been reporting in our enterprise benchmarks for a while now. With the client tests maturing, the time was right for a little convergence.
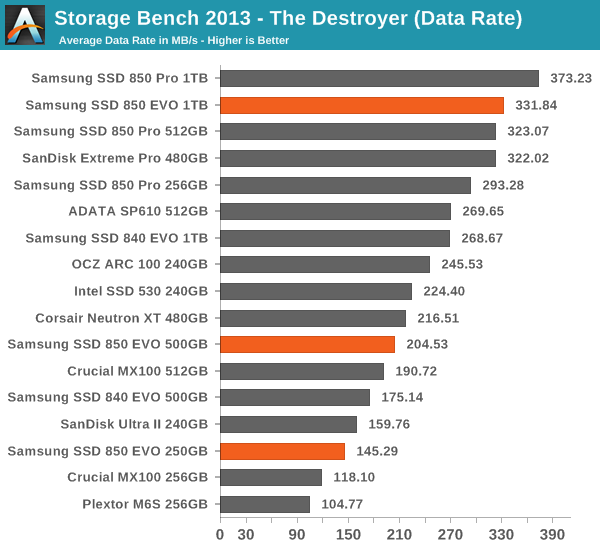
The faster NAND and better IO consistency results in increased performance in our 2013 Storage Bench. The 1TB version shines in the test and isn't far from the 850 Pro, but the 500GB and 250GB models end up being middle-class performers. Especially the performance of the 250GB model is a bit underwhelming because it is beaten by the Ultra II, even though the 850 EVO should have a performance advantage thanks to V-NAND.


97 Comments
View All Comments
TEAMSWITCHER - Monday, December 8, 2014 - link
I'm in complete agreement. I'm not going to buy another 2.5" SSD before I can get an 850 Pro (512 GB) equivalent with an M.2 interface. I have two motherboards with empty M.2 slots waiting for the market to catch up. I know about the XP941, but the pricing isn't great. M.2 drives should cost almost the same as a 2.5" drive...especially after eliminating the worthless metal/plastic box.extide - Monday, December 8, 2014 - link
Seems to me like TLC will become the standard mainstream for 3D/VNAND, where as MLC will be pretty much only for high end/enterprise, somewhat like SLC was back in the day.MadDuffy - Monday, December 8, 2014 - link
Newegg prices (USD) are up:120 GB - 90
250 GB - 140
500 GB - 250
1 TB - 470
Email I received indicates these are promotional prices available through Dec 14th
casperes1996 - Monday, December 8, 2014 - link
Last page, fifth paragraph, last line:"If I was"
Should be: "If I were"
I know I'm a cunt for pointing it out, but I only do so because I generally think Anandtech offers fairly decently written articles, and I care too much about this sort of piss...
Sorry.
apudapus - Monday, December 8, 2014 - link
How is data retention with this type of TLC NAND? Can the drive be powered off for a week or a month before data gets corrupted? While the drive is powered on, I assume there are refresh features for stale (a.k.a. infrequently accessed) data.hojnikb - Monday, December 8, 2014 - link
If its up to jedec (i imagine it is) then its good for atleast a year.kgh00007 - Monday, December 8, 2014 - link
But in reality what are they going to be like? I don't think I'll buy another Samsung TLC drive after owning the 120 GB 840 EVO for the last while! It performs erratically, especially when resuming from hibernate. It can take anywhere from 10 secs to boot, up to 5 minutes, and I have applied the latest firmware and run the speed recovery app from Samsung. I have an mSata Crucial m500 240GB which is slower on paper, but in reality is much quicker and the performance is 100% consistent, it does the same thing, every time at the same speed!!MLC all the way for me without any turbowrite nonsense, just straight forward advertised speeds across the whole drive all the time, without loosing data due to poor charge retention along the way!
Lolimaster - Monday, December 8, 2014 - link
Your EVO is 120 and your other drive is 240, less nand, more erratic, simple. Look at the chart, you get consistent writes/read with 500-1TB models.kgh00007 - Saturday, December 13, 2014 - link
Less nand equals slower performance, not more erratic performance. But it should perform at it's given speed consistentantly. I have over 30% of the drive free and 10% set as over provisioning on the 840 EVO. There is no excuse for a 5 minute boot time with an SSD. I don't trust these Samsung drives after my experience!mlkmade - Monday, December 8, 2014 - link
So I'm confused as its not very clear...Is Turbowrite turned on for all your benchmarks?Is turbowrite needed to hit the the 540/520 read/write times? I saw the chart with TurboWrite on and off. So with turbowrite off this drive only gets 100mb/s ?
This article is very vague in regards to that.