Corsair Neutron XT (240GB, 480GB & 960GB) SSD Review: Phison S10 Debuts
by Kristian Vättö on November 17, 2014 9:00 AM ESTAnandTech Storage Bench 2013
Our Storage Bench 2013 focuses on worst-case multitasking and IO consistency. Similar to our earlier Storage Benches, the test is still application trace based – we record all IO requests made to a test system and play them back on the drive we are testing and run statistical analysis on the drive's responses. There are 49.8 million IO operations in total with 1583.0GB of reads and 875.6GB of writes. I'm not including the full description of the test for better readability, so make sure to read our Storage Bench 2013 introduction for the full details.
| AnandTech Storage Bench 2013 - The Destroyer | ||
| Workload | Description | Applications Used |
| Photo Sync/Editing | Import images, edit, export | Adobe Photoshop CS6, Adobe Lightroom 4, Dropbox |
| Gaming | Download/install games, play games | Steam, Deus Ex, Skyrim, StarCraft 2, BioShock Infinite |
| Virtualization | Run/manage VM, use general apps inside VM | VirtualBox |
| General Productivity | Browse the web, manage local email, copy files, encrypt/decrypt files, backup system, download content, virus/malware scan | Chrome, IE10, Outlook, Windows 8, AxCrypt, uTorrent, Ad-Aware |
| Video Playback | Copy and watch movies | Windows 8 |
| Application Development | Compile projects, check out code, download code samples | Visual Studio 2012 |
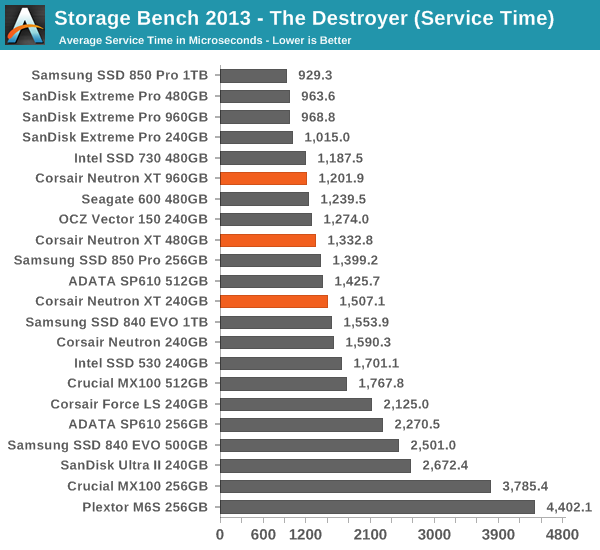
We are reporting two primary metrics with the Destroyer: average data rate in MB/s and average service time in microseconds. The former gives you an idea of the throughput of the drive during the time that it was running the test workload. This can be a very good indication of overall performance. What average data rate doesn't do a good job of is taking into account response time of very bursty (read: high queue depth) IO. By reporting average service time we heavily weigh latency for queued IOs. You'll note that this is a metric we have been reporting in our enterprise benchmarks for a while now. With the client tests maturing, the time was right for a little convergence.
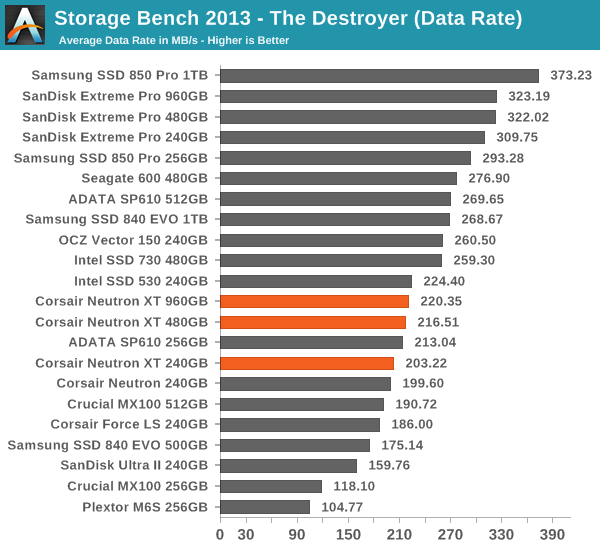
The Neutron XT offers a healthy performance boost over the Force LS in our 2013 Storage Bench, but overall ends up in the middle-class. The Phison S10 platform appears to be very competitive with Silicon Motion's SM2246EN (ADATA SP610 in the graphs), but it can't challenge the high-end drives from Samsung, SanDisk, and OCZ.


56 Comments
View All Comments
hojnikb - Monday, November 17, 2014 - link
At this point, we have a better chance of finding Loch Ness Monster than getting sf3700 :)eddieobscurant - Monday, November 17, 2014 - link
epic !!!glugglug - Monday, November 17, 2014 - link
Any endurance testing done?I have a Neutron 512GB (not GTX) and am pretty disppointed at what the wear leveling indicator from SMART data is telling me..... it looks like the 512GB Neutron has an expected write endurance of only 100TB?
Kristian Vättö - Monday, November 17, 2014 - link
I haven't done any endurance testing, but Corsair is rating the Neutron XT at 124TB (according to The Tech Report). Note that the SMART data isn't usually an indication of an expected failure as the threshold has been set by the manufacturer for warranty reasons, so they can determine whether you've exceeded the endurance rating. In that light 100TB is pretty good because most drives are rated at around 70TB or so.Joepublic2 - Monday, November 17, 2014 - link
I'm disappointed to see them dropping the 5 year warranty on the Neutron line. I bought a Neutron and a Neutron GTX for myself and a few dozen for various clients primarily due to the 5 year warranty. Expected endurance figures mean nothing to me as a user if the company isn't willing to back it up with a appropriate warranty.Kristian Vättö - Tuesday, November 18, 2014 - link
Actually, there was an error in the reviewer's guide, so the warranty is indeed 5 years similar to the original Neutron series. I've updated the article as well.glugglug - Sunday, November 23, 2014 - link
That is very reassuring.One other disturbing thing is the raw read error rate reported in SMART. It starts out looking good after a cold boot, then gradually drops to a value of "1" as the system gets a higher uptime. I think this is actually calculated wrong, being a direct mapping from the raw value, which is always identical to the "Soft ECC Correction Rate" raw value (sitting at ~250,000 after about a month of uptime), instead of being calculated based on the rate of change in that raw value like its supposed to be. Corsair SSD Toolbox labels that counter as "informational only", while CrystalDiskInfo, Stablebit Scanner, & other tools complain when the nominal value crosses the apparent manufacturer suggested threshold of "6" after a week or so.
Restarting Windows does NOT reset the counter -- it gets reset only by a cold boot.
extide - Monday, November 17, 2014 - link
That wear leveling indicator has very little to do with ACTUAL flash lifetime. It is mostly to do with giving the manufacturer the ability to determine when warranty has expired.sonicmerlin - Monday, November 17, 2014 - link
It's really kinda cool these things have quad core processors now.On a side note, does anyone know when someone other than Samsung is going to release 3D NAND?
Kristian Vättö - Tuesday, November 18, 2014 - link
IMFT (i.e. Micron and Intel) is next year and so is SK Hynix. Toshiba/SanDisk is H1'16.