The iPhone 6 Review
by Joshua Ho, Brandon Chester, Chris Heinonen & Ryan Smith on September 30, 2014 8:01 AM EST- Posted in
- Smartphones
- Apple
- Mobile
- iPhone 6
GPU Performance
While we don't quite have real games to benchmark against, we do have benchmarks that are reasonably good approximations of games, which heavily stress the GPU. For the most part, this means that we can see the performance of the A8's PowerVR GX6450 GPU but there are some aspects that are CPU-bound, which we'll discuss after the results.
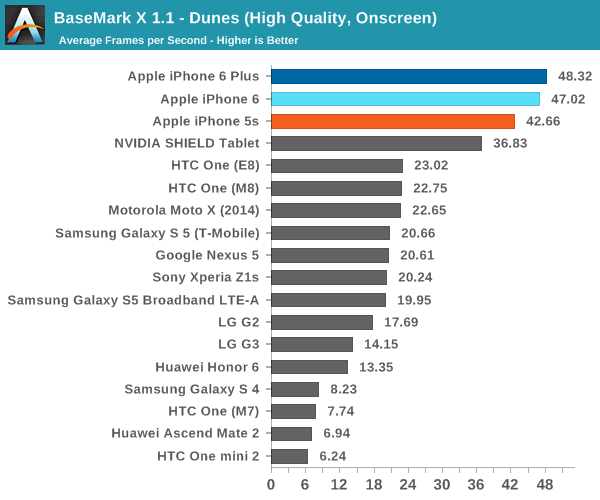
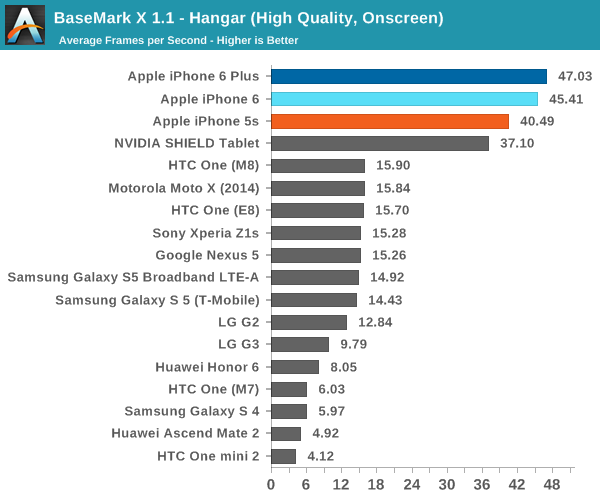
Edit: Before I get into the results, I must caution that Basemark X will have inaccurate on-screen results as the benchmark was made using XCode 5.x in order to keep scores comparable between versions 1.1 and 1.1.1. This doesn't affect the overall score, which is solely calculated based upon off-screen performance.
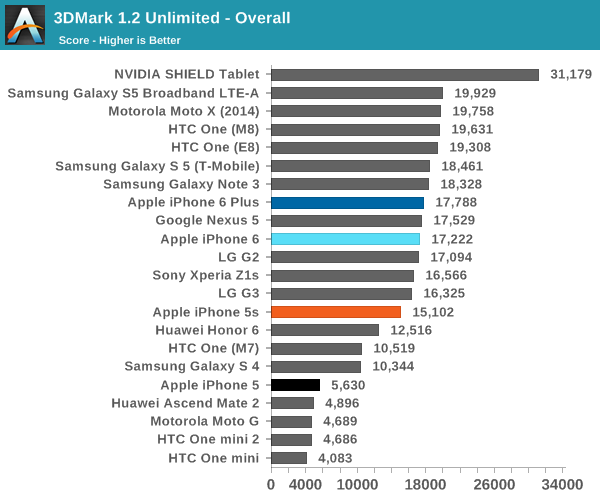
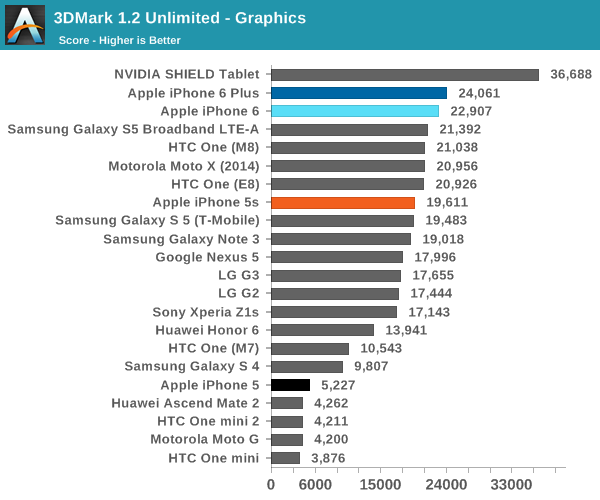
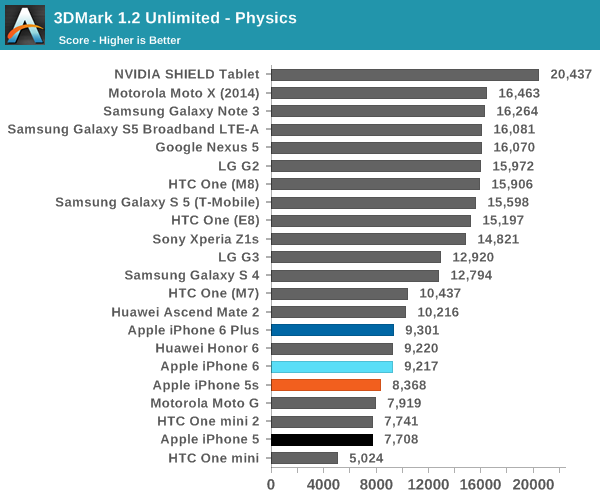
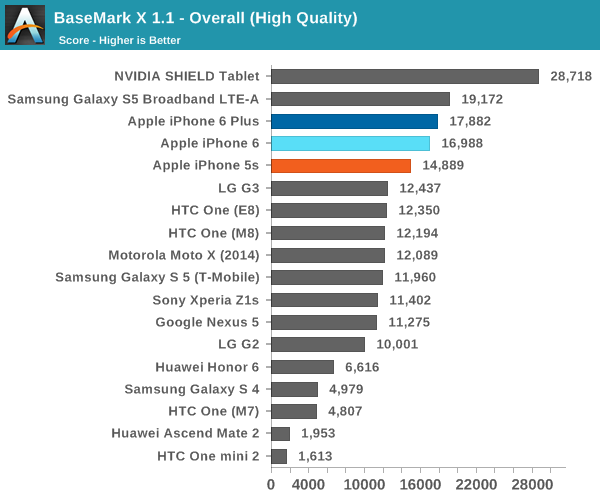
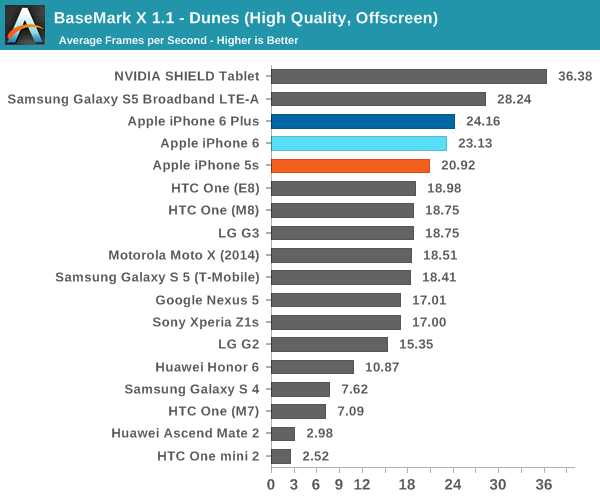
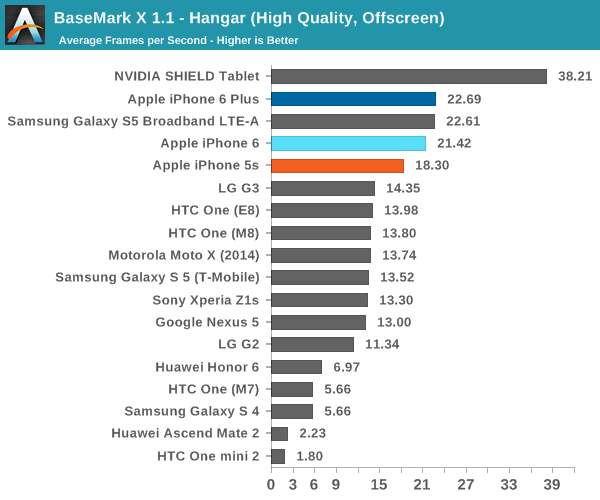
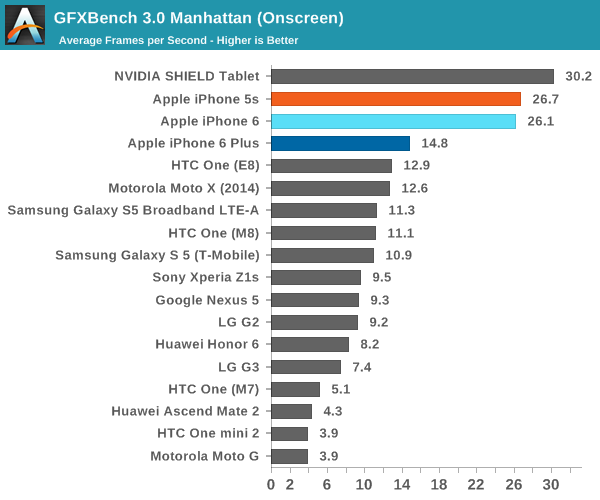
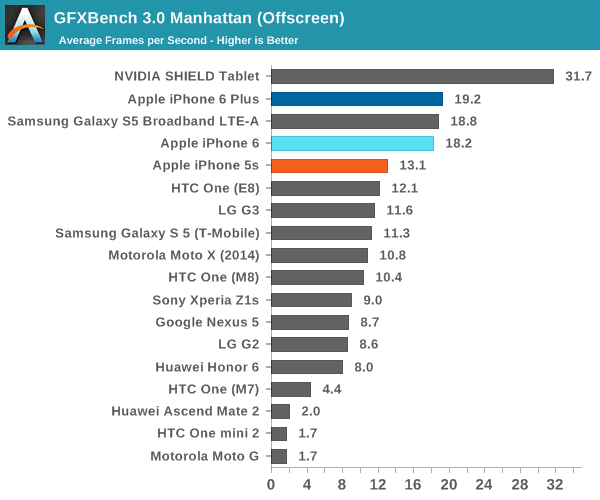
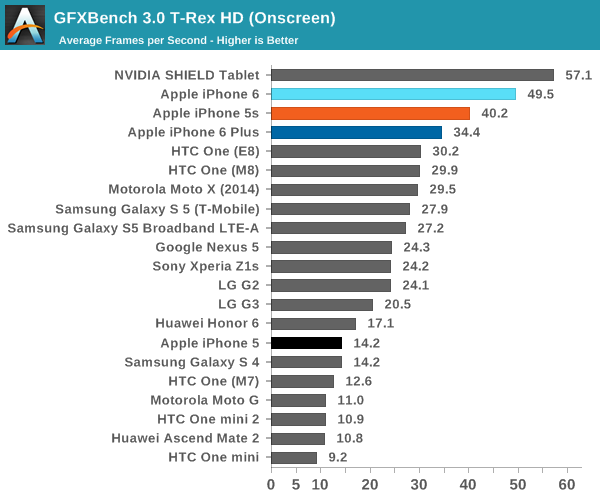
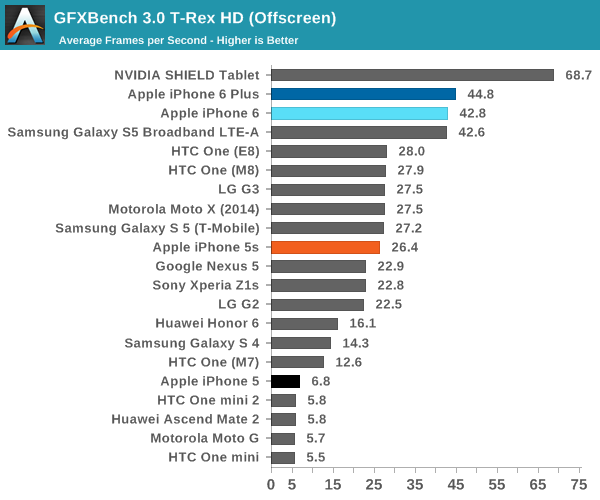
For the most part, we see that the GX6450 is at about the same level as Qualcomm's Adreno 420, which seems to track closely to expectations given that the A7's GPU was around the same performance as the Adreno 330. The 3DMark test does have an interesting result, but it seems that this is because 3DMark's physics test has a strong amount of data dependency that restricts the level of out of order execution that can be done. NVIDIA's Tegra K1 is the current leader in graphics performance, but of course it's also in a tablet instead of a smartphone so it's not a direct competitor.
NAND Performance
As we move towards the goal of seamless performance in everyday tasks, one significant factor is IO performance. While there's definitely a minimum level of performance that allows for generally acceptable smoothness, there's value in having higher storage performance (e.g. prevent bottlenecking in situations such as updating apps in the background). In order to test this, we use Androbench with some custom settings on Android and a custom utility developed by Eric Patno for iOS, who has been quite helpful with furthering our efforts to test storage performance.
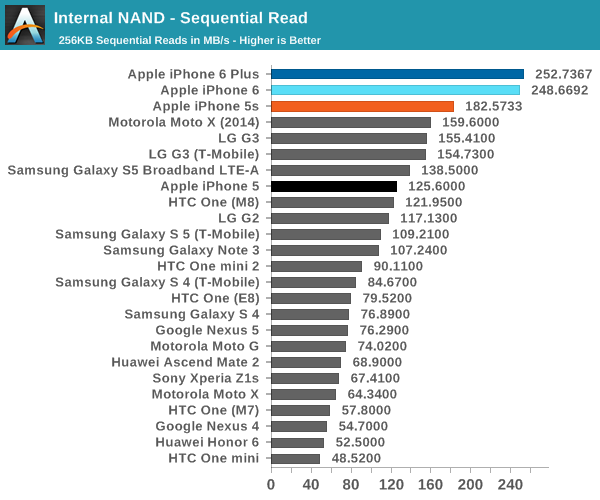
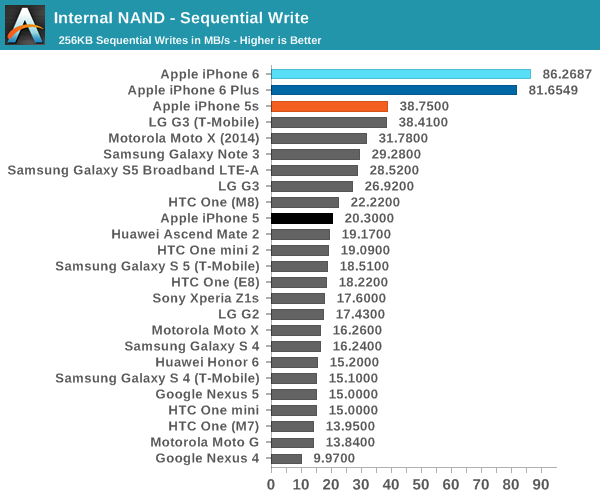
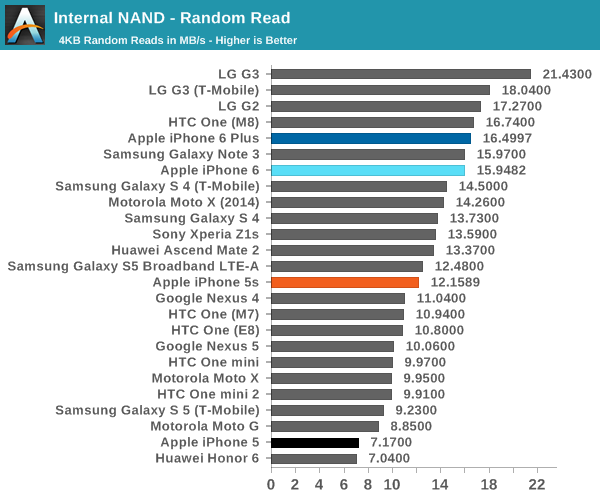
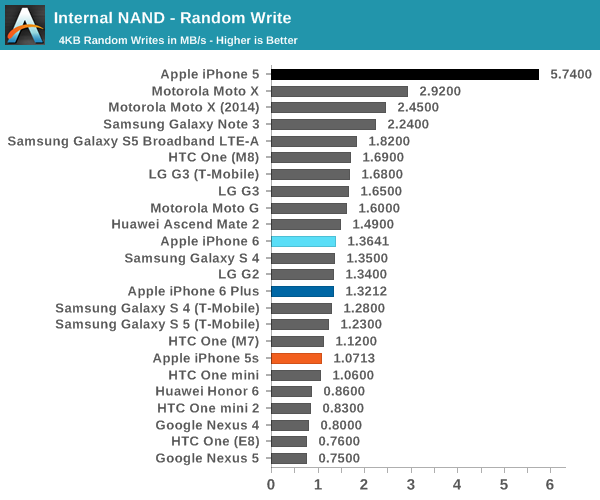
As this is the first time that we've looked into NAND performance on iOS devices, it's definitely worth scrutinizing the data a bit more closely than in most cases. There are a few notable cases here, which are the class-leading speeds for sequential reads and writes on the iPhone 6, but also the rather middling random read and write speeds for the iPhone 6 and 5s. The oddest result is definitely the iPhone 5, which is Ryan's personal unit and while the random read speeds are on the low side, random write speeds are easily record-setting.
In practice, with tablets and smartphones being less multitasking heavy than PCs/laptops, the sequential scores are probably slightly more relevant to the overall user experience. The iPhone 6 results show a significant increase in performance over the iPhone 5s in all of the tests, which is always good to see.


531 Comments
View All Comments