AMD Radeon R9 285 Review: Feat. Sapphire R9 285 Dual-X OC
by Ryan Smith on September 10, 2014 2:00 PM ESTCompute
Jumping into compute, our expectations regarding compute performance are going to be a mixed bag. On the one hand as part of the newer GCN 1.2 architecture AMD has been doing some tweaking under the hood, but on the other hand the most important aspects of the architecture – the memory model and thread execution – are not fundamentally different from the GCN 1.0 R9 280. As a result we’re not necessarily expecting to find any performance leaps here but there is the possibility that we will find some along the way.
As always we’ll start with LuxMark2.0, the official benchmark of SmallLuxGPU 2.0. SmallLuxGPU is an OpenCL accelerated ray tracer that is part of the larger LuxRender suite. Ray tracing has become a stronghold for GPUs in recent years as ray tracing maps well to GPU pipelines, allowing artists to render scenes much more quickly than with CPUs alone.
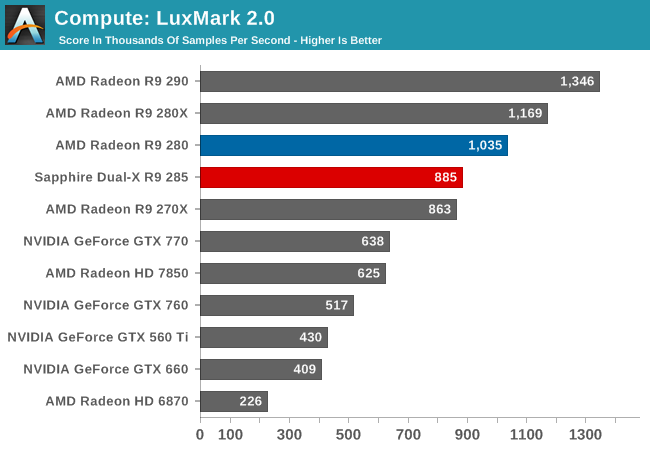
Right off the bat we find an unexpected regression in performance with LuxMark. All things considered we would expect the R9 285 to score similarly to the R9 280 given their nearly identical theoretical FP32 throughput, similar to what we’ve seen in our gaming benchmarks. Instead we have the R9 285 trailing its predecessor by 15%, and coming very close to tying the otherwise much slower R9 270X. Given that this is a new architecture there are a few possibilities here including a lack of OpenCL driver optimizations on AMD’s part, though we can’t entirely rule out bandwidth either since ray tracing can burn up bandwidth at times. Tonga is after all first and foremost a graphics product, and AMD’s memory bandwidth saving compression technology is similarly designed for graphics and not compute, meaning the R9 285 doesn’t have much to make up for the loss of bandwidth in compute tasks versus the R9 280.
In any case, even with R9 285 lagging the R9 280, it’s otherwise a strong showing for AMD. AMD cards overall perform very well on this benchmark compared to NVIDIA’s offerings, so the R9 285 has no trouble shooting well past the GTX 760.
Our 2nd compute benchmark is Sony Vegas Pro 12, an OpenGL and OpenCL video editing and authoring package. Vegas can use GPUs in a few different ways, the primary uses being to accelerate the video effects and compositing process itself, and in the video encoding step. With video encoding being increasingly offloaded to dedicated DSPs these days we’re focusing on the editing and compositing process, rendering to a low CPU overhead format (XDCAM EX). This specific test comes from Sony, and measures how long it takes to render a video.
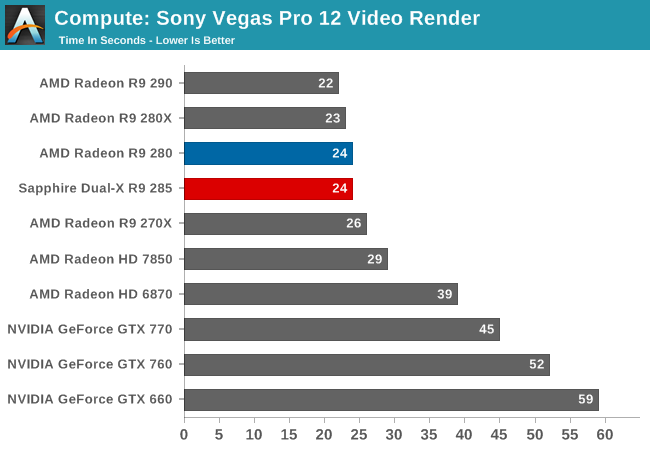
Unlike LuxMark, we aren’t seeing a performance gain nor a regression here. The R9 285 is every bit as fast as the R9 280. Meanwhile as has consistently been the case in this benchmark, all of AMD’s cards are well ahead of our NVIDIA cards.
Our 3rd benchmark set comes from CLBenchmark 1.1. CLBenchmark contains a number of subtests; for our standard benchmark suite we focus on the most practical of them, the computer vision test and the fluid simulation test. The former is a useful proxy for computer imaging tasks where systems are required to parse images and identify features (e.g. humans), while fluid simulations are common in professional graphics work and games alike.
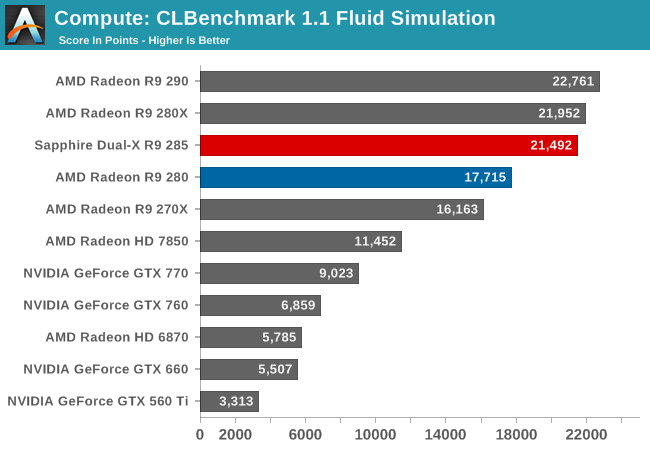
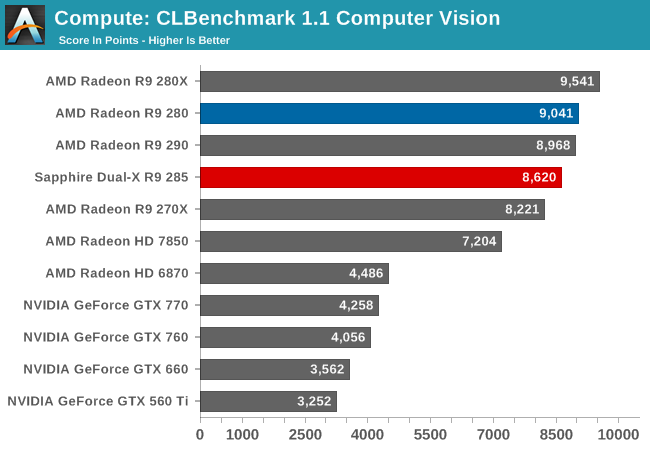
Depending on which subtest we’re looking at, the R9 285 either outperforms or trails the R9 280. The fluid simulation subtest finds the R9 285 performing just shy of the more powerful R9 280X, while the R9 285 comes up short of the R9 280 in computer vision. Computer vision is the more bandwidth sensitive benchmark of the two, so it follows that it’s the benchmark more likely to be influenced by the loss of raw memory bandwidth. Otherwise the R9 285’s strong showing in the fluid simulation is unexpected, and given what we know we’re at a bit of a loss to explain it.
Looking at the broader picture, this is yet another test where AMD’s cards do well against NVIDIA’s non-compute cards. Overall the R9 285 is 2-3x faster than the GTX 760 here.
Moving on, our fourth compute benchmark is FAHBench, the official Folding @ Home benchmark. Folding @ Home is the popular Stanford-backed research and distributed computing initiative that has work distributed to millions of volunteer computers over the internet, each of which is responsible for a tiny slice of a protein folding simulation. FAHBench can test both single precision and double precision floating point performance, with single precision being the most useful metric for most consumer cards due to their low double precision performance. Each precision has two modes, explicit and implicit, the difference being whether water atoms are included in the simulation, which adds quite a bit of work and overhead. This is another OpenCL test, utilizing the OpenCL path for FAHCore 17.
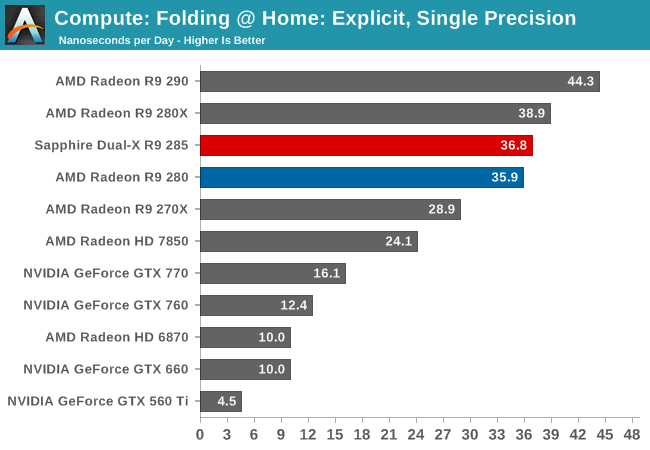
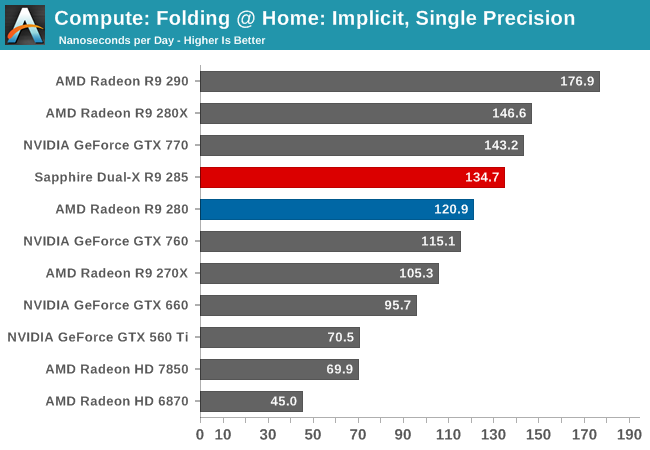
When it comes to single precision the R9 285 edges out the R9 280, though not significantly so. R9 285 still seemingly benefits from some of the GCN 1.2 architectural optimizations, but not to the same extent we’ve seen in other benchmarks.
Overall AMD’s GCN cards are a strong performer in this benchmark and the R9 285 is no exception. GTX 760 trails R9 285 when it comes to implicit single precision, and is blown away in the explicit single precision benchmark.
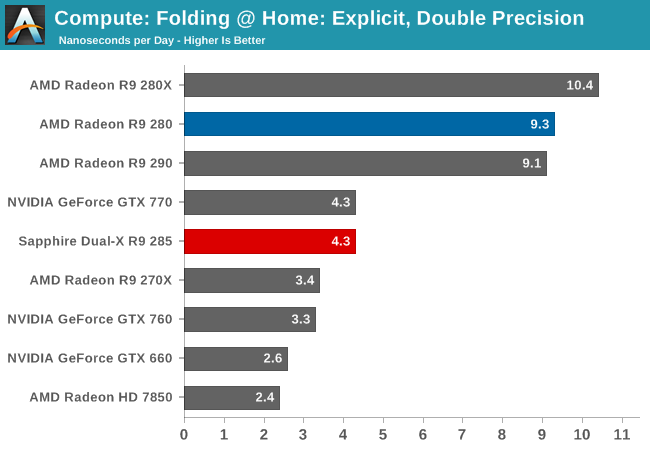
Meanwhile for double precision the R9 285 falls well behind the R9 280. Since Tonga is not designed to pull double-duty as a graphics and high performance compute GPU like Tahiti was, Tonga is configured for 1/16 rate double precision performance, 1/4 the rate of the more powerful Tahiti. As a result it can never keep up with the R9 280 in a double precision workload. Consequently AMD and the R9 285 still have a lead in F@H with double precision, but not to the degree we’ve seen elsewhere. The R9 285 is only about 30% faster than the GTX 760 here.
Wrapping things up, our final compute benchmark is an in-house project developed by our very own Dr. Ian Cutress. SystemCompute is our first C++ AMP benchmark, utilizing Microsoft’s simple C++ extensions to allow the easy use of GPU computing in C++ programs. SystemCompute in turn is a collection of benchmarks for several different fundamental compute algorithms, with the final score represented in points. DirectCompute is the compute backend for C++ AMP on Windows, so this forms our other DirectCompute test.
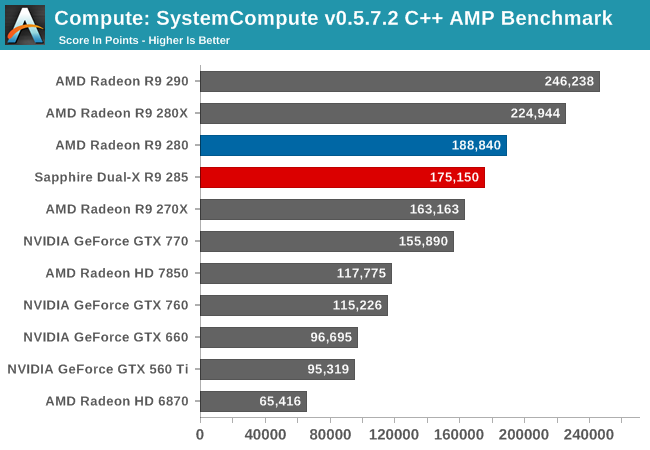
SystemCompute exposes another case where the R9 285 comes up short compared to the R9 280, though only slightly. AMD’s latest card can deliver 93% of the performance of an R9 280, and most likely it’s suffering just a bit from the reduction in memory bandwidth. Otherwise it’s still more than 50% ahead of the GTX 760 and still comfortably ahead of the more powerful GTX 770.


86 Comments
View All Comments
Samus - Wednesday, September 10, 2014 - link
Am I missing something or is this card slower than the 280...what the hell is going on?tuxRoller - Wednesday, September 10, 2014 - link
Yeah, you're missing something:)Samus - Thursday, September 11, 2014 - link
BF4 its about 4% slower.Kenshiro70 - Wednesday, September 10, 2014 - link
"something of a lateral move for AMD, which is something we very rarely see in this industry"Really? Seems like the industry has been rebadging for the last two release cycles. How about starting to test and show results on 4k screens? 60Hz ones are only $500 now, and that will put a little pressure on the industry to stop coasting. I have no intention of spending money on a minor bump up in specs. Bitcoin mining demand can't last forever.
tuxRoller - Wednesday, September 10, 2014 - link
Error page 4: chart should read "lower is better"jeffrey - Wednesday, September 10, 2014 - link
Saw this too, the Video Encode chart Ryan.Congrats btw!
Ryan Smith - Thursday, September 11, 2014 - link
Whoops. Thanks.yannigr2 - Wednesday, September 10, 2014 - link
Great article and review.The only bad news here I think is Mantle.
But on this matter, about Mantle, maybe a slower processor could show less of that performance drop or even keep performing better than DirectX11. Maybe one more test on a slower core, on an FX machine?
mapesdhs - Wednesday, September 10, 2014 - link
What were AMD thinking? How can the 285 be a replacement for the 280, given itsreduced VRAM, while at the same time AMD is pushing Mantle? Makes no sense at all.
Despite driver issues, I'd kinda gotten used to seeing AMD be better than NVIDIA in
recent times for VRAM capacity. A new card with only 2GB is a step backwards. All
NVIDIA has to do is offer a midrange Maxwell with a minimum 4GB and they're home.
No idea if they will. Time will tell.
Ian.
Alexvrb - Wednesday, September 10, 2014 - link
There you have it, and with no issues with boost. Sorry Chizow, so much for that. :PThanks for the in-depth review, Ryan. It appears that power consumption is going to vary from implementation to implementation. Lacking a reference model makes it tricky. Another review I read compared Gigabyte's Windforce OC 285 to a similarly mild OC'd 280, finding a substantial difference in the 285's favor.