The Intel Haswell-E CPU Review: Core i7-5960X, i7-5930K and i7-5820K Tested
by Ian Cutress on August 29, 2014 12:00 PM ESTCPU Benchmarks
The dynamics of CPU Turbo modes, with both Intel and AMD, can cause concern during environments with a variable threaded workload. There is also an added issue of the motherboard remaining consistent, depending on how the motherboard manufacturer wants to add in their own boosting technologies over the ones that the CPU manufacturer would prefer they used. In order to remain consistent, we implement an OS-level unique high performance mode on all the CPUs we test which should override any motherboard manufacturer performance mode.
HandBrake v0.9.9: link
For HandBrake, we take two videos (a 2h20 640x266 DVD rip and a 10min double UHD 3840x4320 animation short) and convert them to x264 format in an MP4 container. Results are given in terms of the frames per second processed, and HandBrake uses as many threads as possible.
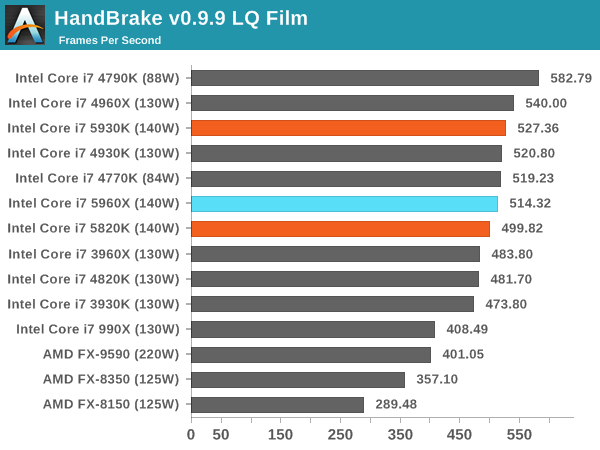
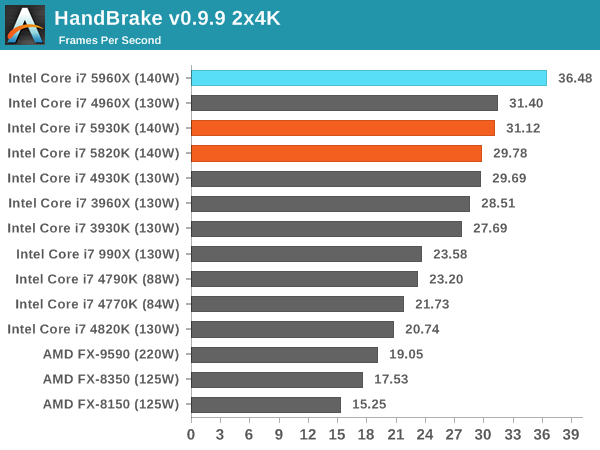
The variable turbo speeds of the CPUs results in a small difference in low quality conversion, and the high single core frequency of the 4790K wins there. For 4K conversion the problem becomes more parallel and the extra cores of the 5960X push it ahead of the pack. The 5930K and 5820K are both behind the 4960X however.
Agisoft Photoscan – 2D to 3D Image Manipulation: link
Agisoft Photoscan creates 3D models from 2D images, a process which is very computationally expensive. The algorithm is split into four distinct phases, and different phases of the model reconstruction require either fast memory, fast IPC, more cores, or even OpenCL compute devices to hand. Agisoft supplied us with a special version of the software to script the process, where we take 50 images of a stately home and convert it into a medium quality model. This benchmark typically takes around 15-20 minutes on a high end PC on the CPU alone, with GPUs reducing the time.
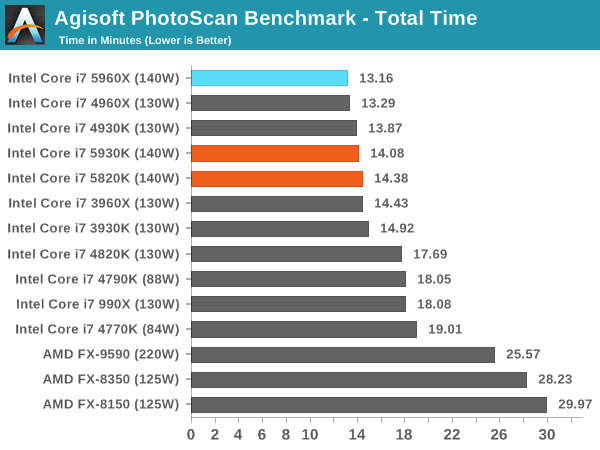
Photoscan's four separate components rely on different amounts of high frequency vs. many cores: check our Bench database for more detailed results but overall the 5960X comes out on top. That being said, the 5820K is less than 40% of the price and is only 1.2 minutes behind.
Dolphin Benchmark: link
Many emulators are often bound by single thread CPU performance, and general reports tended to suggest that Haswell provided a significant boost to emulator performance. This benchmark runs a Wii program that raytraces a complex 3D scene inside the Dolphin Wii emulator. Performance on this benchmark is a good proxy of the speed of Dolphin CPU emulation, which is an intensive single core task using most aspects of a CPU. Results are given in minutes, where the Wii itself scores 17.53 minutes.
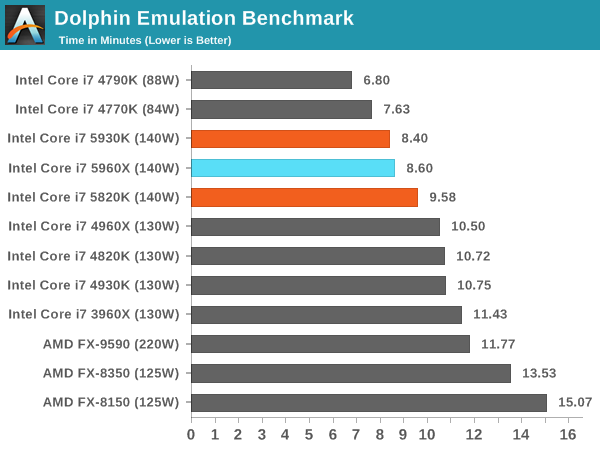
Dolphon loves single core speed and efficiency, meaning the 4790K wins out again. Interestingly the large L3 cache of the 5960X also helps here against the 5820K, despite the 5820K having a higher single thread frequency.
WinRAR 5.0.1: link
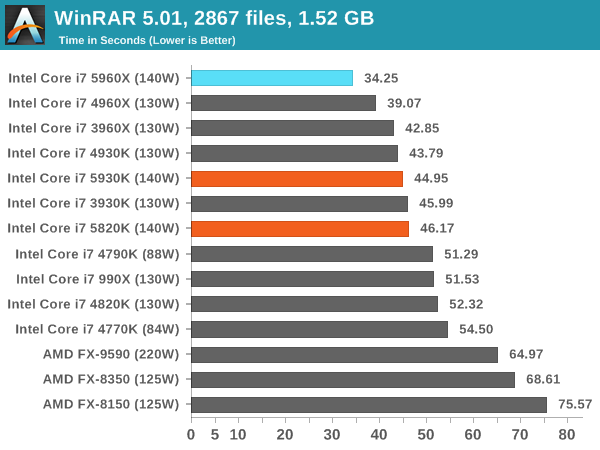
WinRAR is a variable thread workload, but more cores still wins out. Interestingly the xx60X CPUs are ahead of the xx30K CPUs followed by the xx20K. After this comes the 4790K, and then the 990X on par, showing how far three generations of Intel CPU have developed.
PCMark8 v2 OpenCL
A new addition to our CPU testing suite is PCMark8 v2, where we test the Work 2.0 and Creative 3.0 suites in OpenCL mode.
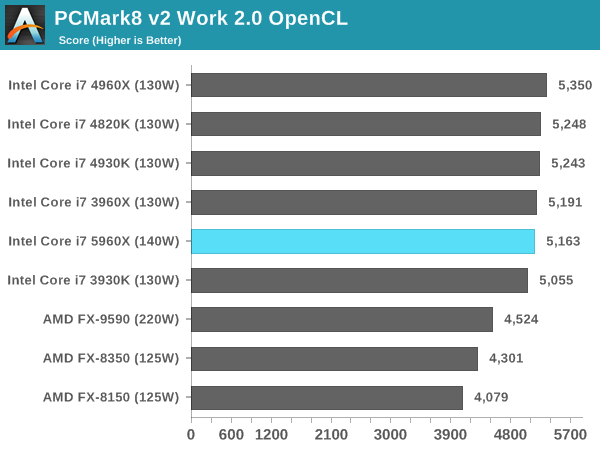
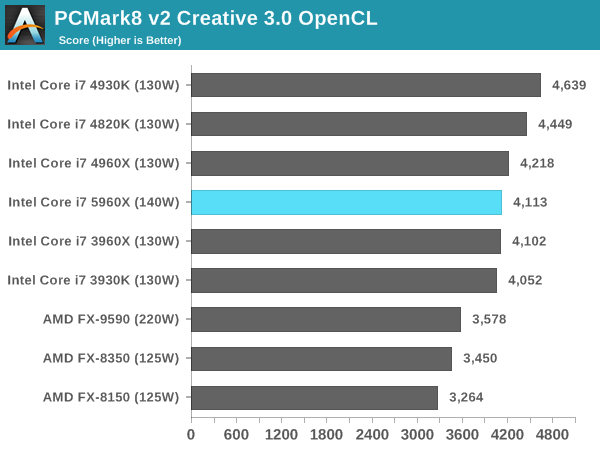
PCMark v8 relies on a number of factors, and it would seem that frequency is preferred over cache and memory. Interestingly the 4930K beat the 4960X in the Creative Suite with no obvious explanation.
Hybrid x265: link
Hybrid is a new benchmark, where we take a 4K 1500 frame video and convert it into an x265 format without audio. Results are given in frames per second.
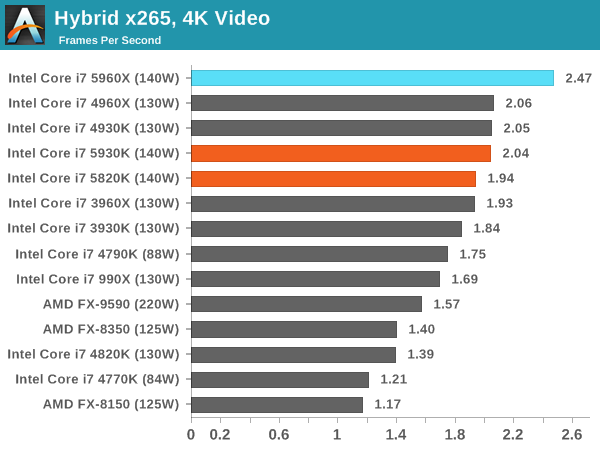
Converting 4K video gets another step in the preference for more cores in Hybrid x265. The 5820K matches the 3960X, showing the progression of CPU generational development.
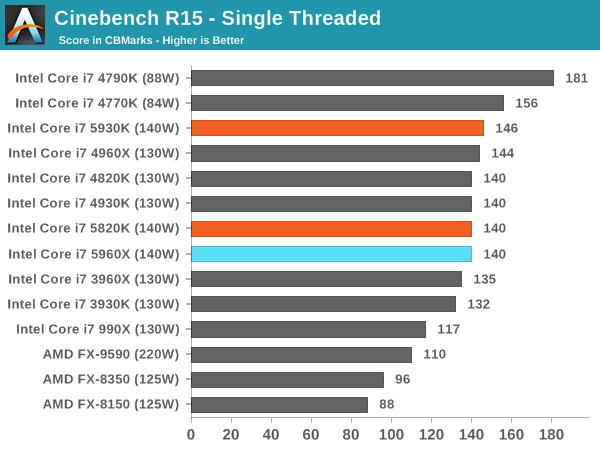
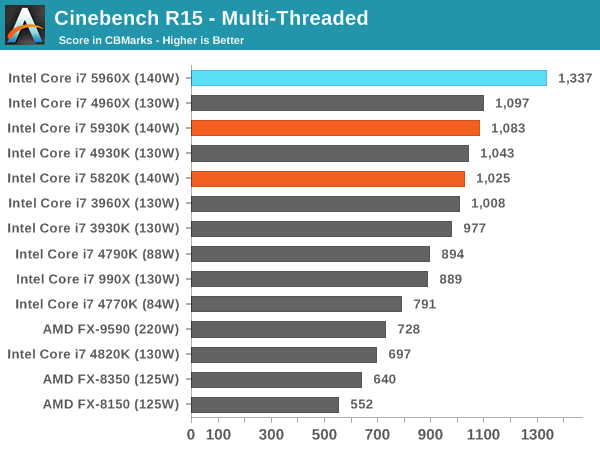
Cinebench R15
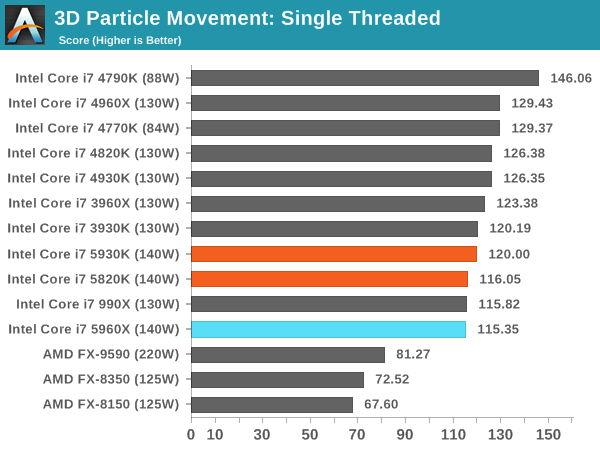
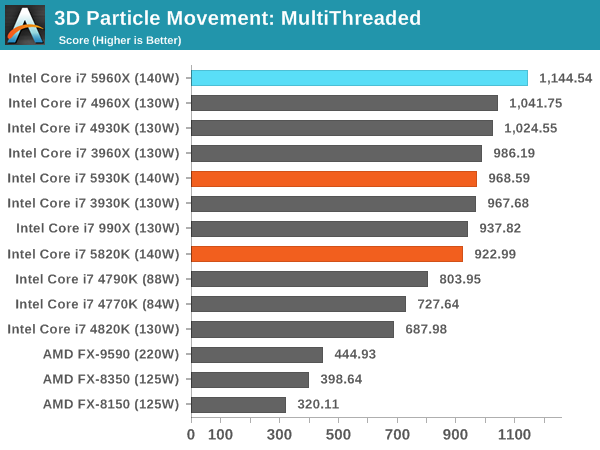
3D Particle Movement
3DPM is a self-penned benchmark, taking basic 3D movement algorithms used in Brownian Motion simulations and testing them for speed. High floating point performance, MHz and IPC wins in the single thread version, whereas the multithread version has to handle the threads and loves more cores.
FastStone Image Viewer 4.9
FastStone is the program I use to perform quick or bulk actions on images, such as resizing, adjusting for color and cropping. In our test we take a series of 170 images in various sizes and formats and convert them all into 640x480 .gif files, maintaining the aspect ratio. FastStone does not use multithreading for this test, and results are given in seconds.
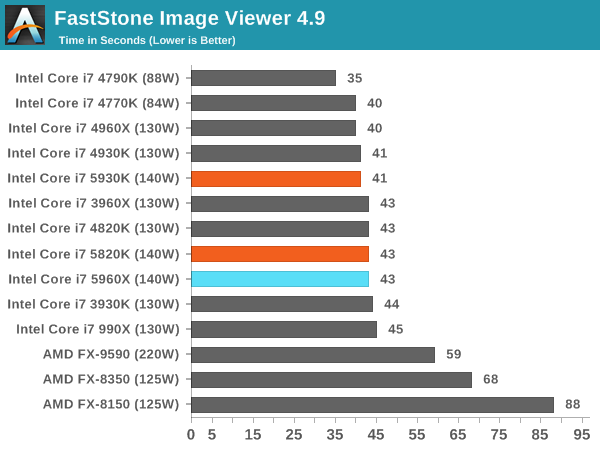
FastStone is a purely single threaded exercise, showing here how the lower core CPUs with high turbo perfom best, and by quite a margin.


203 Comments
View All Comments
Ian Cutress - Monday, September 1, 2014 - link
When I tested the 5930K/5820K, the motherboard BIOSes were still very early alpha builds and did not allow overclocking. If I can get these CPUs in again to test (they had to be sent back), I will do some overclocking results for sure.jwcalla - Friday, August 29, 2014 - link
Might as well wait for them to fix TSX at this point.iwod - Friday, August 29, 2014 - link
How likely will this be in Mac Pro?DigitalFreak - Friday, August 29, 2014 - link
Doubtful. Apple is using Xeons in the Mac Pro.hansmuff - Friday, August 29, 2014 - link
I'll be waiting for two more generations. Maybe something worthwhile comes along to replace my 2600k at 4.4GHz. I'm glad the review shows so clearly where this new chip excels and who should save their money.Yuriman - Friday, August 29, 2014 - link
Typo:"Modules should be available from DDR3-2133 to DDR3-3200 at launch, with the higher end of the spectrum being announced by both G.Skill and Corsair. See our DDR4 article later this week for more extensive testing."
TelstarTOS - Friday, August 29, 2014 - link
Good article but the overclocking comparisons are a bit limited, i.e. 5930K and 5920K overclocking tables are not provided, nor a comparison with older SB/IB cpu @around 4,5ghz which most people still have and are deciding whether to upgrade to a X99 or a Z97 platform.A more accurate RAM performance comparison is also missing.
Ian Cutress - Monday, September 1, 2014 - link
At the time I had the 5930K/5820K, I was not in a position to be able to overclock due to early alpha firmware. Due to our newer benchmarking suite, I still need to go back to the early Sandy (non-E) CPUs to retest. Anything you see in Bench with the power listed has been retested at least in part this year, depending on my scheduling. Unfortunately I don't have the space to have this as an ongoing project, it occurs in time with reviews.name99 - Friday, August 29, 2014 - link
"For the six core models, the i7-5930K and the i7-5820K, one pair of cores is disabled; the pair which is disabled is not always constant, but will always be a left-to-right pair from the four rows as shown in the image. Unlike the Xeon range where sometimes the additional cache from disabled cores is still available, the L3 cache for these two cores will be disabled also."Are you sure that these various statements are correct? I'm not doubting you, but I would point out that at Hot Chips 2014 discussing the Xeon IVB server, Intel stated that they'd designed the floorplan to be "choppable".
They gave a diagram that showed a base of fifteen (3x5) CPUs+L3 slices, which chop lines to take off a th3 right-hand 5 CPUs, then to take off one or two of the horizontal pairs (taking the 10 CPus down to 8 and then 6).
Point is:
- the impression they gave is that these reduced CPU counts are not (at least not PRIMARILY) from full dies with disabled (or nonfunctional) cores --- they are manufactured to have smaller area with fewer cores.
- which suggests that versions with fewer cores but larger cache are some sort of anomaly (because the chop cuts out L3 slices along with cores). Perhaps THOSE are the chips that really did have one or two non-functional cores but with still functional L3 slices?
Ian Cutress - Monday, September 1, 2014 - link
As far as we know, the floorplan for the die for i7 is an 8-core, with the 6-core models being disabled versions rather than wholly new dies.With the Ivy-E Xeons, there are a number of CPUs that have high L3 per core numbers due to the way the cores are disabled - Intel usually sticks to 3 floor plans or so depending on how their product line is stacked up. This may change with Haswell-E, though the Xeons have not been officially released yet. The Ivy-E floorplans can be found here, where I did a breakdown of L3/core:
http://www.anandtech.com/show/7852/intel-xeon-e526...