Samsung SSD 845DC EVO/PRO Performance Preview & Exploring IOPS Consistency
by Kristian Vättö on September 3, 2014 8:00 AM EST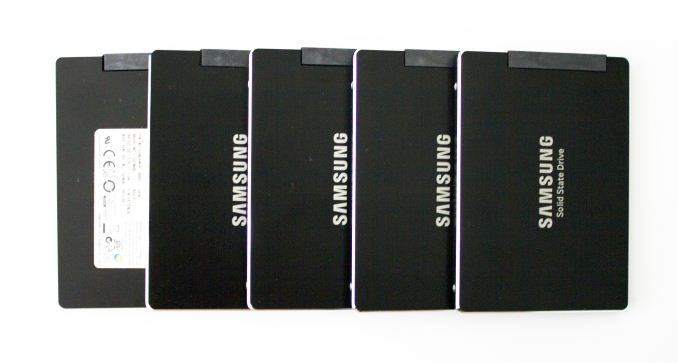
Traditionally Samsung's enterprise SSDs have only been available to large server OEMs (e.g. Dell, EMC, and IBM). In other words, unless you were buying tens of thousands of drives, Samsung would not sell you any. This is a rather common strategy in the industry because it cuts the validation time as you only need to work with a handful of partners and systems, whereas channel products need to be validated for a variety of configurations and may require more aftermarket support as well.
However, back in June Samsung made a change in its strategy and released the 845DC EVO, Samsung's first enterprise SSD for the channel. The 845DC EVO was accompanied by the 845DC PRO a month later, which targets the more write-intensive workloads, whereas the EVO is more geared towards mixed and read-centric workloads. Samsung also sent us the PM853T, which is an OEM version of the 845DC EVO and we now have the chance to see if there is any difference between the channel and OEM versions.
Due to my hectic travel schedule over the past couple of months, I only have a performance preview today. I am in the process of testing the drives through our new enterprise suite, so a full review will follow soon, but I already have a sneak peek of what we will be doing in the future. Or actually, I do not have any new tests to share, but a new way of looking at our existing test data.
In the past our IO consistency test has only looked at the average IOPS in one second intervals, which is an industry standard and a fairly accurate way of describing performance. However, an average is still an average. Modern SSDs can easily process tens of thousands of IOs per second, so even within one second the variation in performance can be huge, which is something that the average does not show.
What we are doing is reporting two additional metrics that give us an idea of what is happening every second. These two are minimum IOPS and standard deviation. The former is simply maximum response time translated into IOPS and it gives us the worst possible IOPS that the drive provides at any given time. The latter, on the other hand, gives us an insight to the performance variation for every single second.
Explaining Throughput, IOPS, and Latency
Before we get to our new benchmarks, there is something I want to discuss regarding storage benchmarking in general that has been bugging me for a while now. Throughput, IOPS, and latency are the three main metrics of storage performance, yet the relation between the three is not that well understood. If you take a look at any enterprise SSD spec sheet, you will very likely see all three metrics used, but what many do not know is that it doesn't have to be that way. Everything could be reported in megabytes or IOs per second, or through latency, and I will soon explain how; meanwhile, manufacturers have chosen to use all three because it suits them better for marketing. To see the relation between the three metrics, we first need to understand what each metric really is.
Let's start with latency because it is ultimately the mother of all other metrics and the simplest to understand. Sometimes IO latency is referred to as response or service time, but ultimately all three terms measure the same thing: the time it takes for an IO to complete. Basically, the measurement starts when the OS sends a request to the drive and ends when the drive finishes processing the request. In the case of a read, the request is considered completed when the OS receives the data, and with writes completion is achieved when the drive informs the OS that it has received the data. Note that receiving the data does not mean that the drive has written the data to its final medium – the drive can send the completion command even though the data is sitting in a DRAM cache (which is why even hard drives can have very high burst speeds).
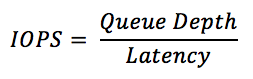
Now that we understand latency, we can have a look at IOPS, which is simply an abbreviation for IOs per second. IOPS describes how many IO operations the drive can handle per second and it is directly related to latency. For instance, if your drive has a constant latency of 1ms (0.001s), your drive can process 1,000 IOs per second. Pretty simple, right? But things get a bit more complicated when we incorporate queue depth into the equation.
Let's assume that it still takes 1ms for our drive to process one IO, but now there are two IO in the queue. As it still takes 1ms to process the first IO, the latency for the second IO cannot be 1ms because the OS already sent the IO request for both, but the second request was placed in a queue as the drive had not finished processing the previous IO. Assuming that both IOs were sent at the same time, the latency of the second IO would be 2ms.
Do you see what happened there? We placed two IOs in the queue (i.e. doubled the queue depth) and suddenly our latency doubled, but our drive was still doing 1,000 IOPS. Basically, we asked the drive to process more IOs by adding them to the queue, but in this case our hypothetical drive could only process 1,000 IOs per second. If we added even more IOs to the queue, the latency would keep increasing because there would be more IOs waiting in the queue and it would still take 1ms to process each one of them.
Fortunately SSDs can take advantage of parallelism by writing to multiple dies and planes at the same time, so in the real world any decent SSD would not be limited to 1,000 IOPS across all queue depths, meaning that the latency would not scale up like crazy as in our example above.

One thing that IOPS does not take into account is the transfer size. Obviously it takes longer to transfer and process 128KB of data than it takes to do the same for 4KB of data, so IOPS can be misleading. In other words, 1,000 IOPS on its own does not tell you anything useful because that could be with a transfer size of 512 bytes, meaning that your drive might only do a mere 125 IOPS with 4KB transfer size, which would be pretty awful for a modern drive.
We need throughput to bring the transfer size into the equation. Throughput measures how many bytes are transferred per second and commonly throughput is measured in mega- or gigabytes per second given the speed of today's storage. Mathematically throughput is simply IOPS times the transfer size as IOPS already tells us how many IOs are happening per second, so all we need is the size of those IOs to know how many bytes are transferred.
Putting The Secret Marketing Sauce Together
What we just learned is that all three specifications – latency, IOPS, and throughput – are ultimately the same. You can translate IOPS to MB/s and MB/s to latency as long as you know the queue depth and transfer size. As I mentioned in the beginning, the reason why we "need" all three is marketing.
Take 128KB sequential performance for instance. 500MB/s sounds much better than ~4,000 IOPS because the 4KB random write IOPS for the same SSD can be 90,000. On the other hand, 90,000 IOPS with 4KB transfer size is only ~370MB/s, so from a marketing perspective it is much better to say that the drive does 500MB/s 128KB sequential and 90,000 IOPS 4KB random.
Latency is no different. It is just another best case scenario figure that the manufacturers want to report to make their product look better. 20µs latency sounds brilliant until you read the actual data sheet and realize that it is often with a sequential 4KB transfer at a queue depth of one. That is the best case scenario because the latency of a random 4KB transfer at queue depth of 32 can easily be several milliseconds, which is far from the stated 20µs latency. If the latency was truly 20µs for a random 4KB transfer at queue depth of 32, then the drive could do 1,600,000 IOPS!
The reason I wanted to cover this is to help everyone understand what the storage metrics really mean and the relationship between them. I have found this to be fairly poorly understood and I want to fix that. We do not necessarily need all three metrics because they just allow for misleading marketing (like the latency example above) and I believe the best way to fix the marketing is to educate the buyers to take the marketing with a grain of salt (or at least read the fine print to see if the figure is meaningful at all).
Test Setup
| CPU | Intel Core i7-4770K running at 3.3GHz (Turbo & EIST enabled, C-states disabled) |
| Motherboard | ASUS Z87 Deluxe (BIOS 1707) |
| Chipset | Intel Z87 |
| Chipset Drivers | Intel 9.4.0.1026 + Intel RST 12.9 |
| Memory | Corsair Vengeance DDR3-1866 2x8GB (9-10-9-27 2T) |
| Graphics | Intel HD Graphics 4600 |
| Graphics Drivers | 15.33.8.64.3345 |
| Desktop Resolution | 1920 x 1080 |
| OS | Windows 7 x64 |
- Thanks to Intel for the Core i7-4770K CPU
- Thanks to ASUS for the Z87 Deluxe motherboard
- Thanks to Corsair for the Vengeance 16GB DDR3-1866 DRAM kit, RM750 power supply, Hydro H60 CPU cooler and Carbide 330R case


31 Comments
View All Comments
Inds - Wednesday, February 4, 2015 - link
Ok, this doesn't clear anything up. If my manufacturer is lying about the IOPS of my SSD, how do I figure out the real value?If they aren't lying about the 97,000 random read IOPS, how many megabytes per second is this for 4KB?
What exactly is the formula? You never elaborate on this in the article beyond senseless ramble.
First of all, how am I gonna know what the queue length even is? The way I see it on benchmark tests, low queue depths have lower MB/s than higher ones so this confuses the hell out of me.
But okay, I wanna know how my 840 Evo will perform random reads in the worst case scenario and QD1 seems to be the worst case scenario according to all the benchmark evidence.
In that case, I must time the QD by the latency. My latency I believe is 1 ms so my result is 1000. 1000 IOPS? Okay, so my 4KB random read speed will be 4 MB/s? That's nowhere close to the real result CrystalDiskMark shows.