Samsung SSD 845DC EVO/PRO Performance Preview & Exploring IOPS Consistency
by Kristian Vättö on September 3, 2014 8:00 AM ESTSamsung SSD 845DC EVO
| Samsung SSD 845DC EVO | |||||
| Capacity | 240GB | 480GB | 960GB | ||
| Controller | Samsung MEX | ||||
| NAND | Samsung 19nm 128Gbit TLC | ||||
| Sequential Read | 530MB/s | 530MB/s | 530MB/s | ||
| Sequential Write | 270MB/s | 410MB/s | 410MB/s | ||
| 4KB Random Read | 87K IOPS | 87K IOPS | 87K IOPS | ||
| 4KB Random Write | 12K IOPS | 14K IOPS | 14K IOPS | ||
| Idle Power | 1.2W | 1.2W | 1.2W | ||
| Load Power (Read/Write) | 2.7W / 3.8W | 2.7W / 3.8W | 2.7W / 3.8W | ||
| Endurance (TBW) | 150TB | 300TB | 600TB | ||
| Endurance (DWPD) | 0.35 Drive Writes per Day | ||||
| Warranty | Five years | ||||
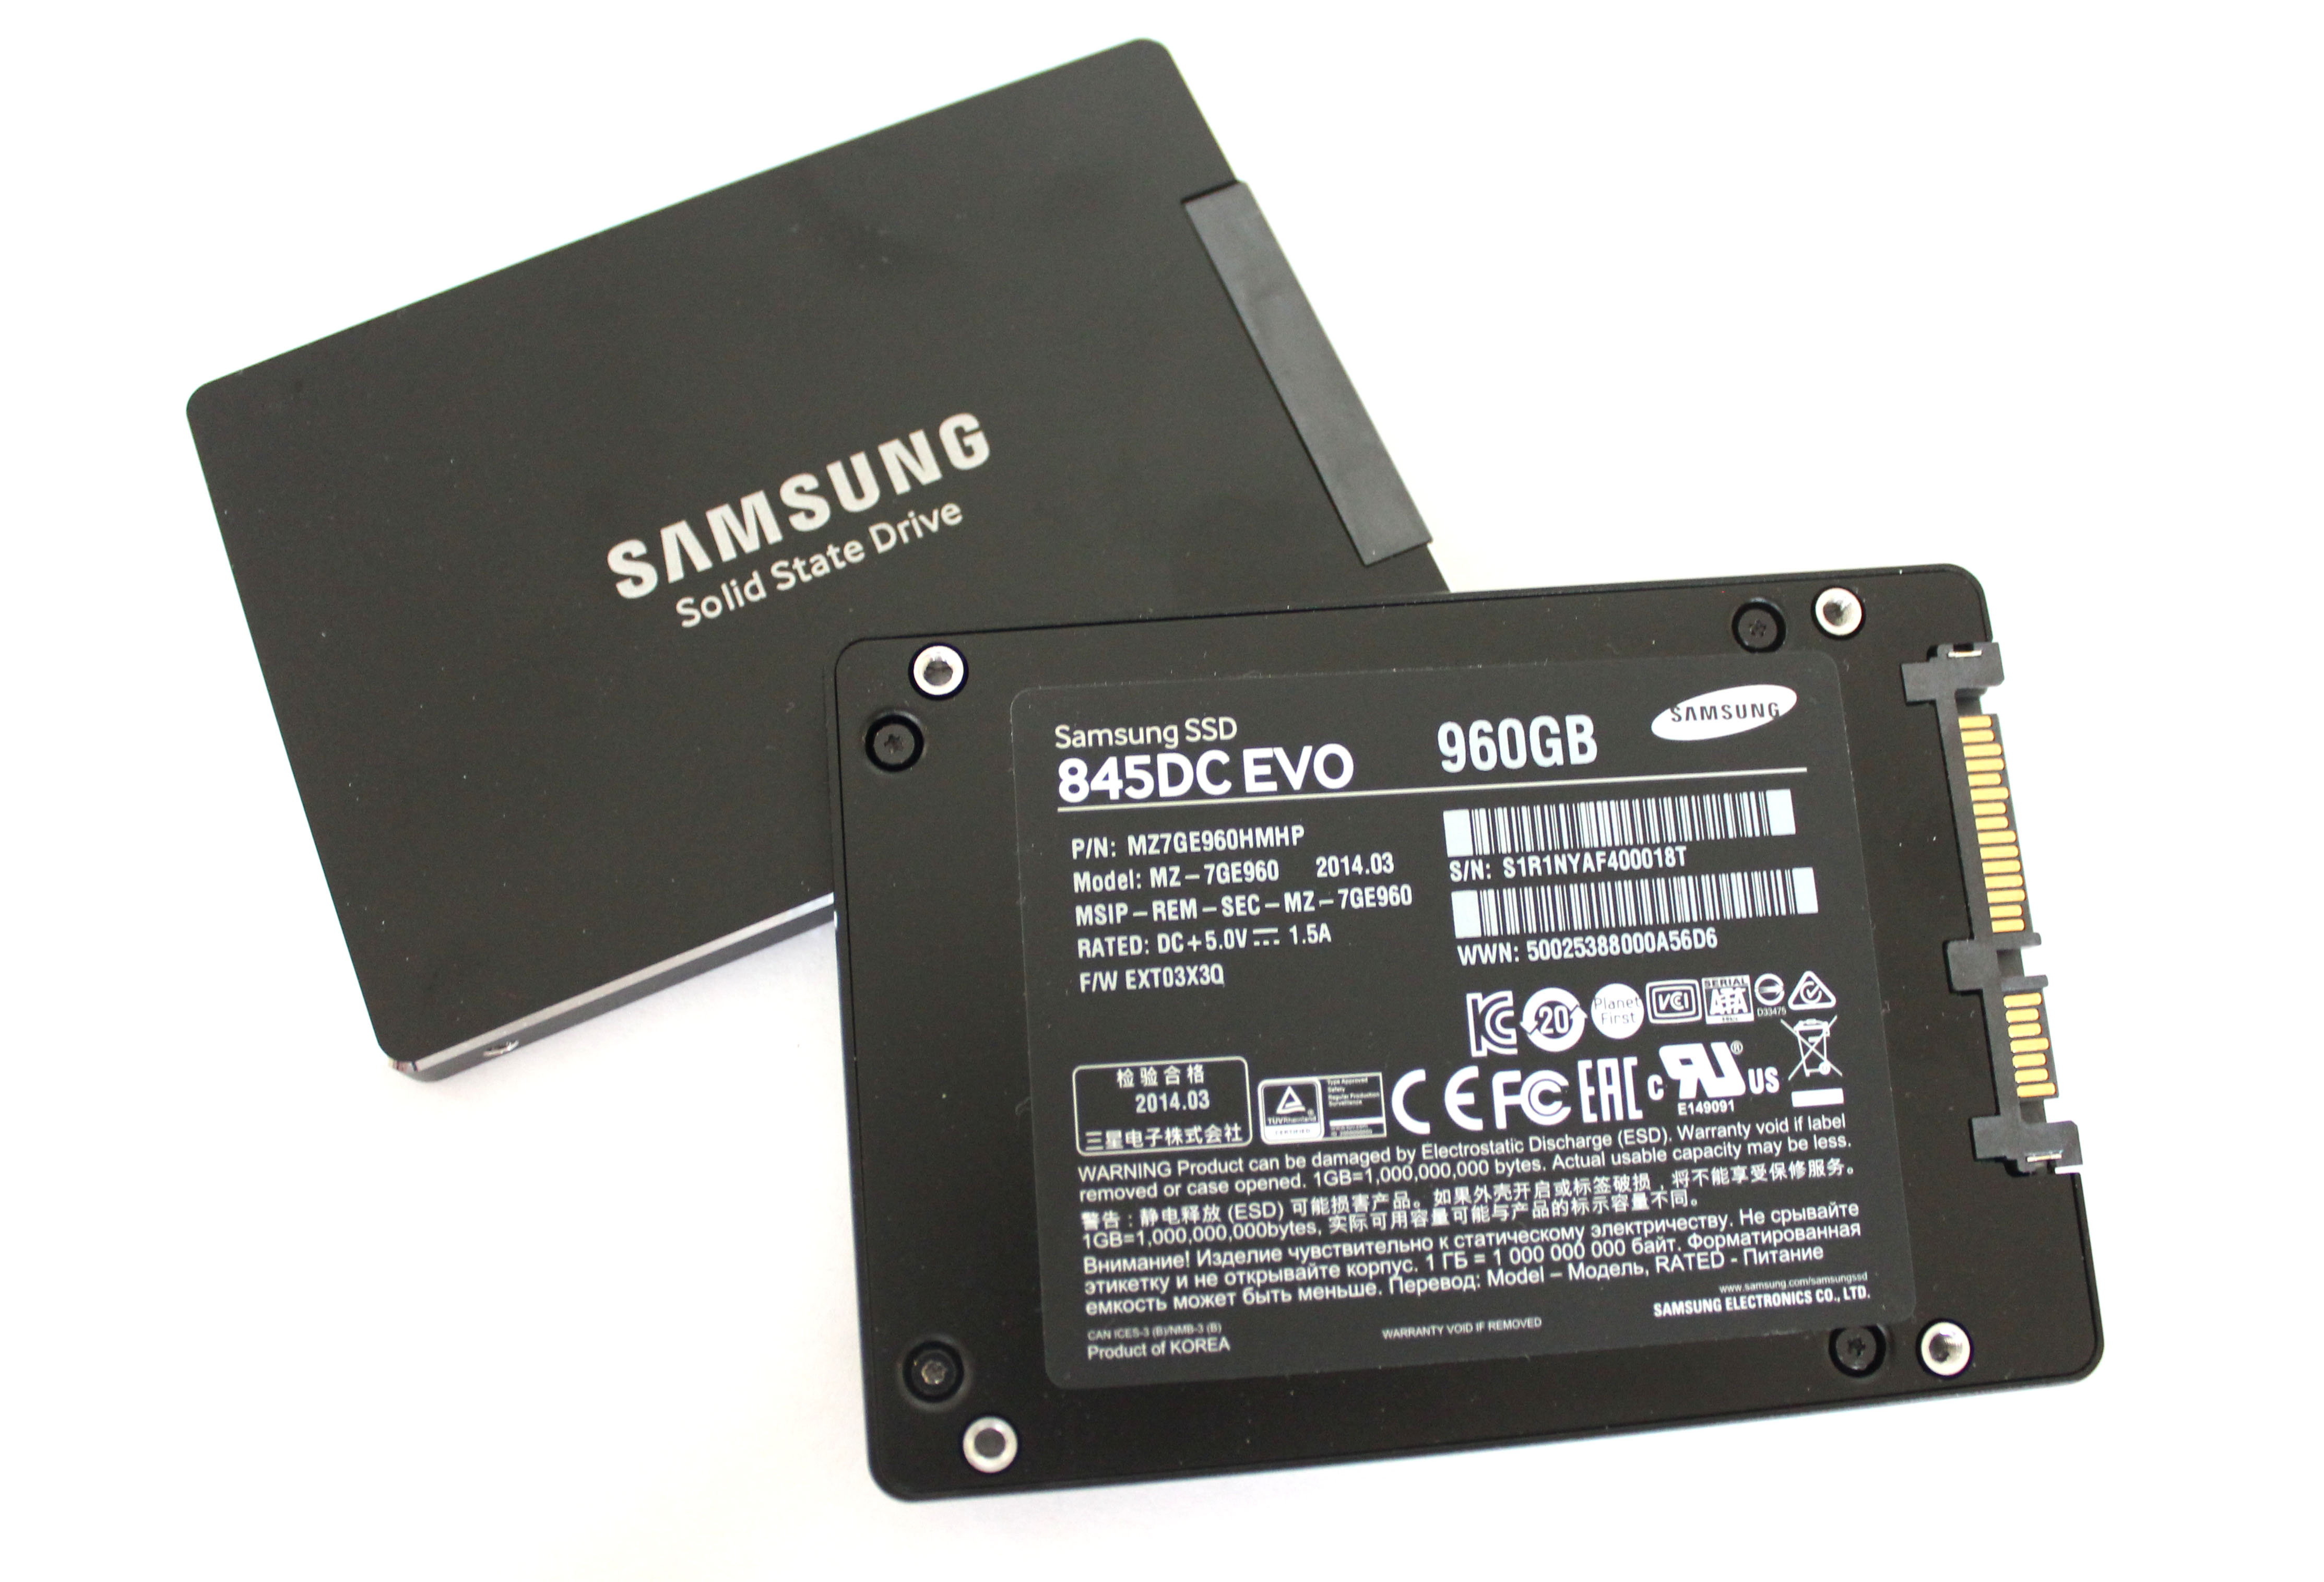
The 845DC EVO is based on the same MEX controller as the 840 EVO and 850 Pro are and it also uses the same 128Gbit 19nm TLC NAND as the EVO. While the SSD 840 was the first client TLC drive, the 845DC EVO is the first enterprise drive to utilize TLC NAND. We have covered TLC in detail multiple times by now, but in a nutshell TLC provides lower cost per gigabyte by storing three bits per cell instead of two like MLC does, but the increased density comes with a tradeoff in performance and endurance.
Based on our endurance testing, the TLC NAND in the SSD 840 and 840 EVO is good for 1,000 P/E cycles, which is about one third of what typical MLC is good for. I have not had the time to test the endurance of 845DC EVO yet, but based on tests run by others, the TLC NAND in the 845DC EVO is rated at 3,000 P/E cycles. I will confirm this in the full review, but assuming that the tests I've seen are accurate (they should be since the testing methology is essentially the same as what we do), Samsung has taken the endurance of TLC NAND to the next level.
I never believed that we would see 19nm TLC NAND with 3,000 P/E cycles because that is what MLC is typically rated at, but given the maturity of Samsung's 19nm process, it is plausible. Unfortunately I do not know if Samsung has done any special tricks to extend the endurance, but I would not be surprised if these were just super high binned dies. In the end, there are always better and worse dies in the wafer and with most TLC dies ending up in applications like USB flash drives and SD cards, the best of the best can be saved for the 845DC EVO.
Ultimately the 845DC EVO is still aimed mostly towards read-intensive workloads because 0.35 drive writes per day is not enough for anything write heavy in the enterprise sector. Interestingly, despite the use of TLC NAND the endurance of the EVO is actually slightly higher than what Intel's SSD DC S3500 offers (150TB vs 140TB at 240GB).

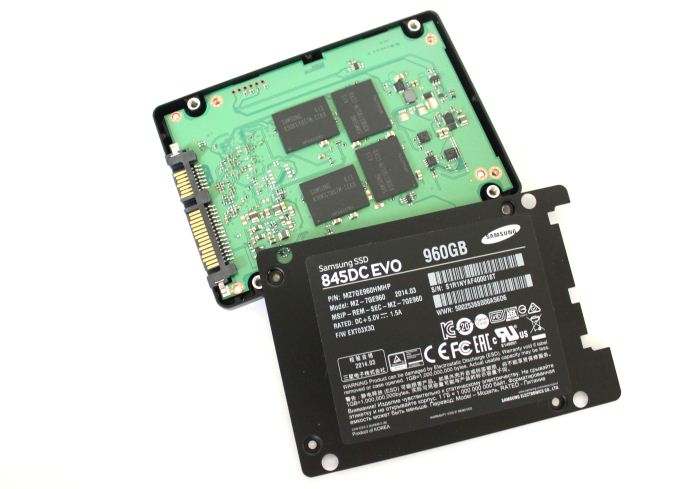
Like most enterprise drives, the 845DC EVO features capacitors to protect the drive against power losses. For client drives it is enough to flush the NAND mapping table from DRAM to NAND frequently enough to prevent corruption, but in the enterprise there is not much room for lost user data.


31 Comments
View All Comments
Laststop311 - Wednesday, September 3, 2014 - link
Wish the consumer m2 drives would be released already. Samsung sm951 with pcie gen 3.0 x4 controller would be nice to be able to buy.tuxRoller - Wednesday, September 3, 2014 - link
All chart titles are the same on page five (performance consistency average iops).tuxRoller - Wednesday, September 3, 2014 - link
Actually, all the charts carry the same title, but different data.Kristian Vättö - Thursday, September 4, 2014 - link
The titles are basically "name of the SSD and its capacity - 4KB Random Write (QD32) Performance". The name of the SSD should change when you select a different SSD but every graph has the "4KB Random Write (QD32) Performance" attached to it.CountDown_0 - Wednesday, September 3, 2014 - link
Hi Kristian,a small suggestion: when talking about worst case IOPS you write that "The blue dots in the graphs stand for average IOPS just like before, but the red dots show the worst-case IOPS for every second." Ok, but I'd write it in the graph legend instead.
Kristian Vättö - Thursday, September 4, 2014 - link
It's something I thought about and can certainly consider adding it in the future.rossjudson - Thursday, September 4, 2014 - link
I'd suggest the following. Use FIO to do your benchmarking. It supports generating and measuring just about every load you'd care about. You can also use it in a distributed mode, so you can run as many tests as you have hardware to support, at the same time.Second, don't use logarithmic axes on your charts. The drives you describe here take *huge* dropoffs in performance after their caches fill up and they have to start "working for a living". You are masking this performance drop by not using linear measures.
Third, divide up your time axis into (say) 60 second chunks, and show the min/max/95/99/99.9/99.9 latency marks. Most enterprise customers care about sustained performance and worst case performance. A really slow IO is going to hold up a bunch of other stuff. There are two ways out of that: Speculative IO (wait a little while for success then issue another IO to another device), or manage and interleave background tasks (defrag/garbage collect) very carefully in the storage device. Better yet, don't have the problem at all. The marketing stats on these drives have nothing to do with the performance they exhibit when they are subject to non-stop, mixed loads.
Unless you are a vendor that constantly tests precisely those loads, and ensures they work, stay working, and stay tight on latency.
SuperVeloce - Thursday, September 4, 2014 - link
Great review... but dropdown menu for graphs annoys me. ughKristian Vättö - Thursday, September 4, 2014 - link
What do you find annoying in them? I can certainly consider alternative options if you can suggest any.grebic - Thursday, October 2, 2014 - link
Hi Kristian. I need to bother you with a question: do you think isit worth it to stick this SSD in a NAS? I have a ''fanless'' QNAP HS-210, 2 bay small form NAS, without drives for the moment, so in order to have a complete zero noise and time ''resistence'' to go for SSDs. But I was forgoten what was mentioned here "no wear leveling, no garbage collection'', so I'm wondering if in time the performances will decrease dramatically I'm thinking that the OS of NAS is not knowing to do such ''treatments'' over SSDs for maintaining performances, no? It's not in my intention to do operations over operations on NAS but I would like to know that my data will be ''safe'' and easy ''accesible'' over long time, OK? Very appreciated your oppinion. Thanks, Cristian