Samsung SSD 850 Pro (128GB, 256GB & 1TB) Review: Enter the 3D Era
by Kristian Vättö on July 1, 2014 10:00 AM ESTAnandTech Storage Bench 2013
Our Storage Bench 2013 focuses on worst-case multitasking and IO consistency. Similar to our earlier Storage Benches, the test is still application trace based - we record all IO requests made to a test system and play them back on the drive we are testing and run statistical analysis on the drive's responses. There are 49.8 million IO operations in total with 1583.0GB of reads and 875.6GB of writes. I'm not including the full description of the test for better readability, so make sure to read our Storage Bench 2013 introduction for the full details.
| AnandTech Storage Bench 2013 - The Destroyer | ||
| Workload | Description | Applications Used |
| Photo Sync/Editing | Import images, edit, export | Adobe Photoshop CS6, Adobe Lightroom 4, Dropbox |
| Gaming | Download/install games, play games | Steam, Deus Ex, Skyrim, Starcraft 2, BioShock Infinite |
| Virtualization | Run/manage VM, use general apps inside VM | VirtualBox |
| General Productivity | Browse the web, manage local email, copy files, encrypt/decrypt files, backup system, download content, virus/malware scan | Chrome, IE10, Outlook, Windows 8, AxCrypt, uTorrent, AdAware |
| Video Playback | Copy and watch movies | Windows 8 |
| Application Development | Compile projects, check out code, download code samples | Visual Studio 2012 |
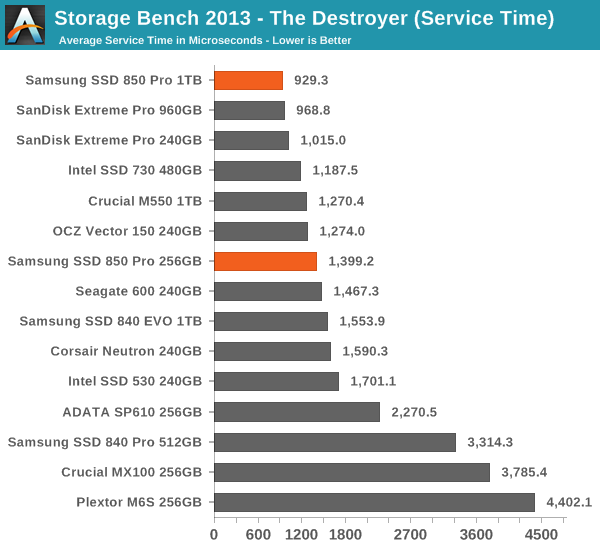
We are reporting two primary metrics with the Destroyer: average data rate in MB/s and average service time in microseconds. The former gives you an idea of the throughput of the drive during the time that it was running the test workload. This can be a very good indication of overall performance. What average data rate doesn't do a good job of is taking into account response time of very bursty (read: high queue depth) IO. By reporting average service time we heavily weigh latency for queued IOs. You'll note that this is a metric we have been reporting in our enterprise benchmarks for a while now. With the client tests maturing, the time was right for a little convergence.
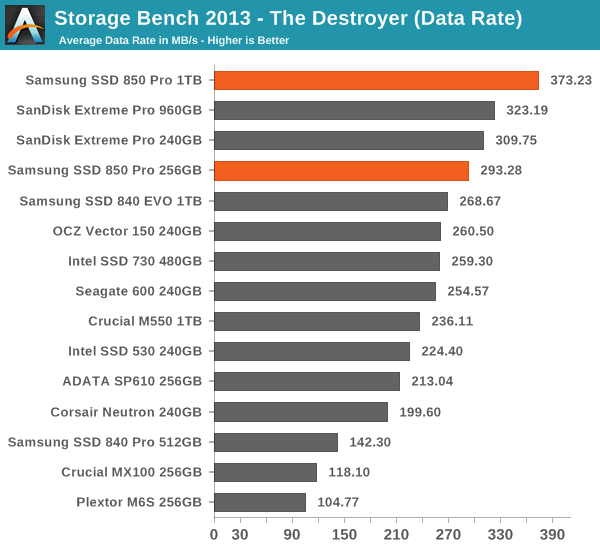
Thanks to the excellent IO consistency, the 850 Pro dominates our 2013 Storage Bench. At the 1TB capacity point, the 850 Pro is over 15% faster than any drive when looking at the average data rate. That is huge because the 850 Pro has less over-provisioning than most of today's high-end drives and the 2013 Storage Bench tends to reward drives that have more over-provisioning because it essentially pushes drives to steady-state. The 256GB model does not do as well as the 1TB one but it is still one of the fastest drives in its class. I wonder if the lesser amount of over-provisioning is the reason or perhaps the Extreme Pro is just so well optimized for mixed workloads.


160 Comments
View All Comments
frenchy_2001 - Tuesday, July 1, 2014 - link
the 3D structure and design are revolutionary, but the manufacturing technology is actually a very mature one (40nm). This makes it *MUCH* cheaper than the 1X used by their competition.Samsung has really struck gold with that design, as it allows them to scale in both dimensions, depending on the result and cost of each. While 2D NAND is facing really tough challenges to increase density, V-NAND is allowed to either scale up (more layers) or restart scaling pitch, as manufacturing is *very well* understood from 40nm->~16nm. They just need to experiment with it and see what makes economic sense and good trade-offs.
toyotabedzrock - Tuesday, July 1, 2014 - link
Almost seems like it would be cheaper to ramp up the production of silicon ingots and drive that cost down further than the r&d for this.frenchy_2001 - Tuesday, July 1, 2014 - link
Silicon ingots cost is marginal. The real cost for scaling is all the R&D necessary to make the pitch smaller. Even using bigger wafers (current ones are 300mm, there have been talks of 450mm for a while, but cost is a deterrent, as a whole fab needs to be re-tooled for the upgrade) only improves yields and costs marginally.NAND scaling down is facing huge challenges, due both to process (who to image those ~15nm line on a wafer) and electrical limits (~3 electrons inside your cell at 15nm). 3D NAND allows to restart the growth by bypassing those challenges (step back to 40nm process and scale in the Z axis).
General SOCs are facing similar process limits (there is no solution below 10nm so far, despite the whole industry cooperating to find one), even if their design limits are more relaxed (SOCs are not trapping charges, but cross talk and interference are starting to be challenges too).
UltraWide - Monday, June 30, 2014 - link
Will there be a version with PCIe or M.2?Gigaplex - Monday, June 30, 2014 - link
If you'd read the article, you'd know the controller doesn't support PCIe.Gigaplex - Monday, June 30, 2014 - link
"This further suggests that the issue lies in our tests instead of the RAPID software itself as end-users will always run the drive with a partition anyway."Um, no. I don't care what the end user does, the software shouldn't cause a BSOD. If it can't cache without a partition, it should simply not attempt to cache. This is just a case of Samsung thinking that just because they do some nice hardware, that they're experts in software. They're really not. RAM caching of I/O isn't specific to SSDs anyway, why are they tying it to an SSD launch?
Donuts123 - Wednesday, July 2, 2014 - link
Yeah, that's a huge red flag for me, I definitely wouldn't use the RAPID software. Another layer to go wrong (and apparently it does). I hope Anandtech submits details of the BSODs they saw to Samsung.RAPID probably just uses the Samsung SSD as a dongle. Presumably RAPID is derived from Samsung's acquisition of NVELO, see http://www.anandtech.com/show/6518/samsung-acquire...
Guspaz - Monday, June 30, 2014 - link
Wait a minute, 150TB endurance on a 1TB drive? Only 150 cycles? That doesn't make any sense, that's absurdly low.Then again, Intel's rating for the 335 doesn't make any sense either. They say 20GB a day for 3 years, or about 22TB... But they also rate it for 3000 cycles, and the media wear indicator on the drive is set to treat 3000 as full wear, and that represents 720TB...
Kristian Vättö - Tuesday, July 1, 2014 - link
The endurance figures are usually based on a 4KB random write workload and are thus worst-case numbers. 150TB of random writes means a ton of more NAND writes than 150TB, that's why. I explained the calculation of TBW here:http://www.anandtech.com/show/7947/micron-m500-dc-...
However, as I mentioned in the article, in the client space the endurance is more for guidance (i.e. don't put these in servers!) than an actual technical limit.
emn13 - Tuesday, July 1, 2014 - link
...but outside of server-like workloads, what's going to benefit from this performance?