Samsung SSD 850 Pro (128GB, 256GB & 1TB) Review: Enter the 3D Era
by Kristian Vättö on July 1, 2014 10:00 AM ESTPerformance Consistency
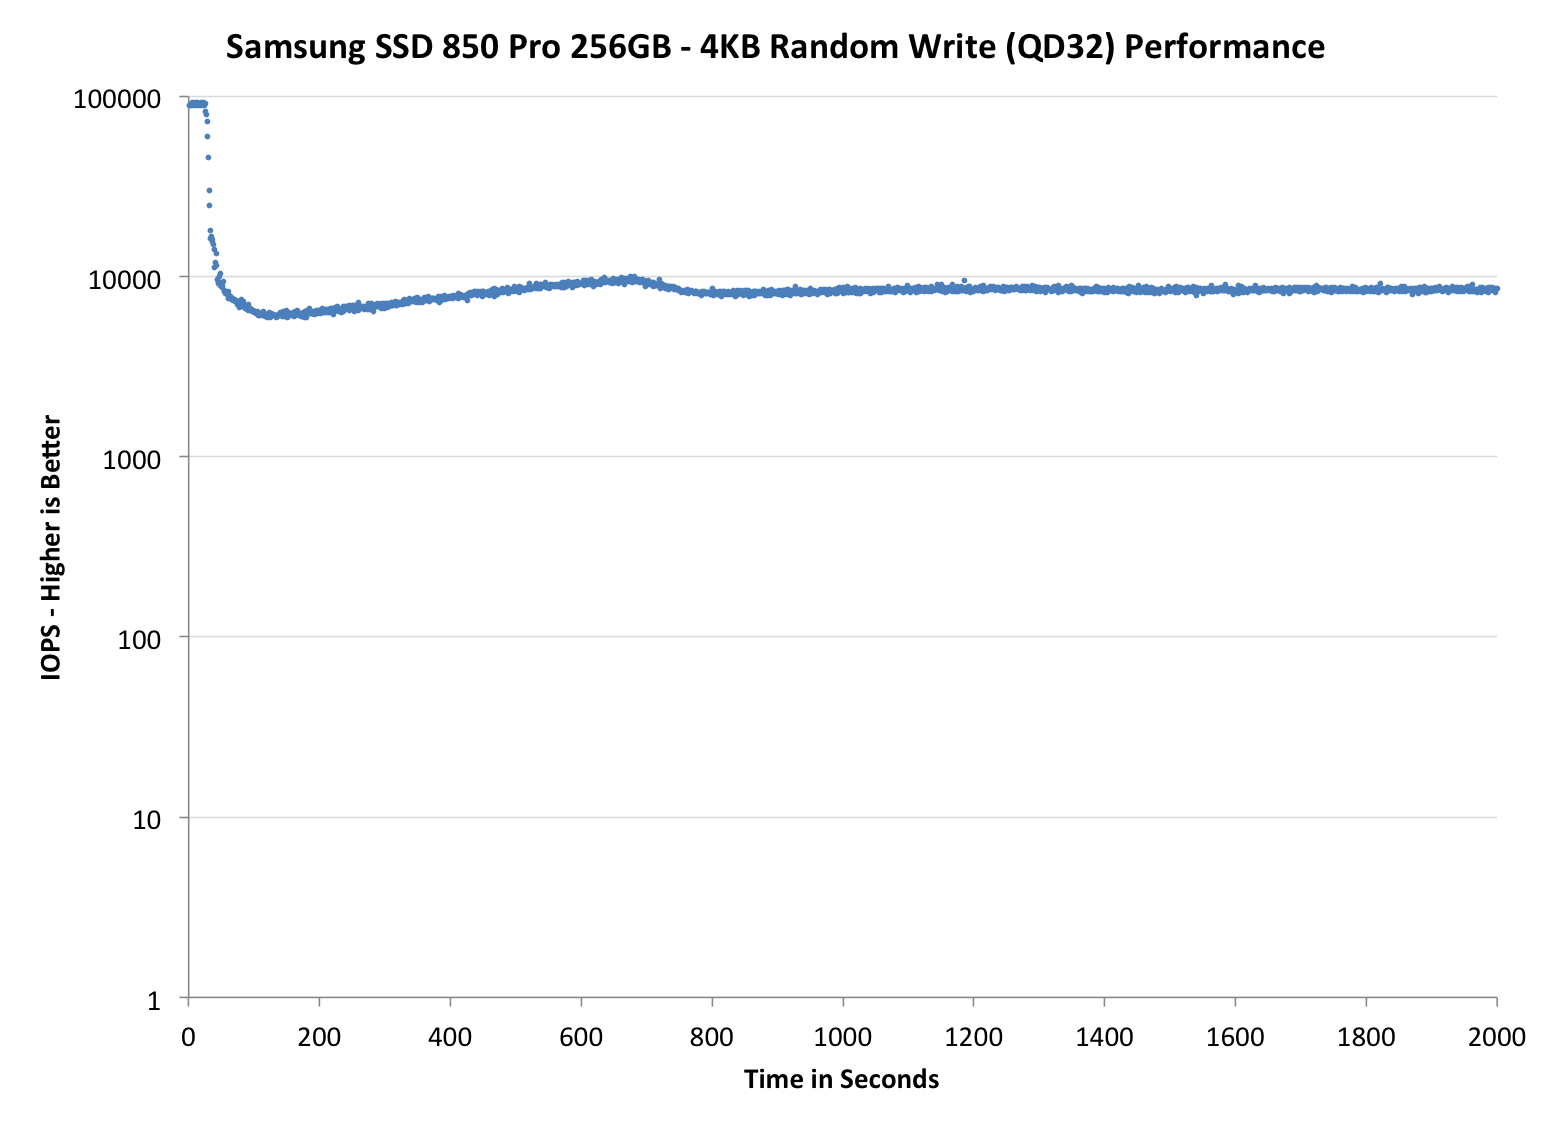
Performance consistency tells us a lot about the architecture of these SSDs and how they handle internal defragmentation. The reason we don’t have consistent IO latency with SSD is because inevitably all controllers have to do some amount of defragmentation or garbage collection in order to continue operating at high speeds. When and how an SSD decides to run its defrag or cleanup routines directly impacts the user experience as inconsistent performance results in application slowdowns.
To test IO consistency, we fill a secure erased SSD with sequential data to ensure that all user accessible LBAs have data associated with them. Next we kick off a 4KB random write workload across all LBAs at a queue depth of 32 using incompressible data. The test is run for just over half an hour and we record instantaneous IOPS every second.
We are also testing drives with added over-provisioning by limiting the LBA range. This gives us a look into the drive’s behavior with varying levels of empty space, which is frankly a more realistic approach for client workloads.
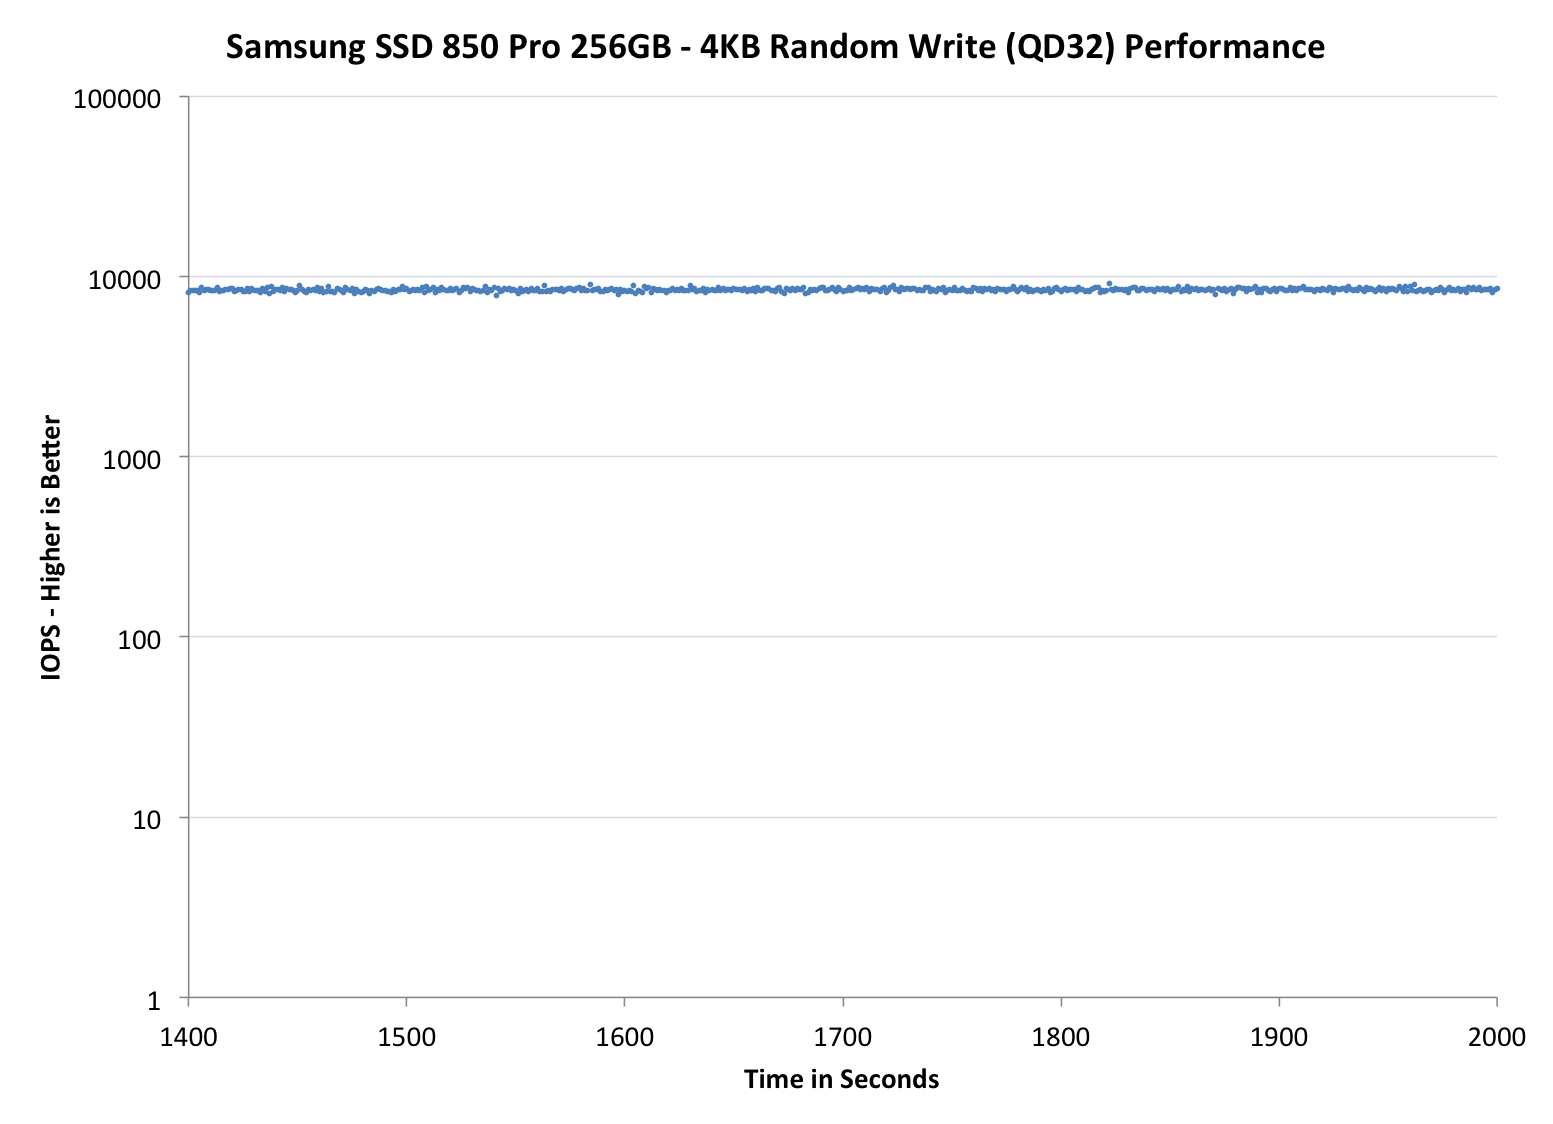
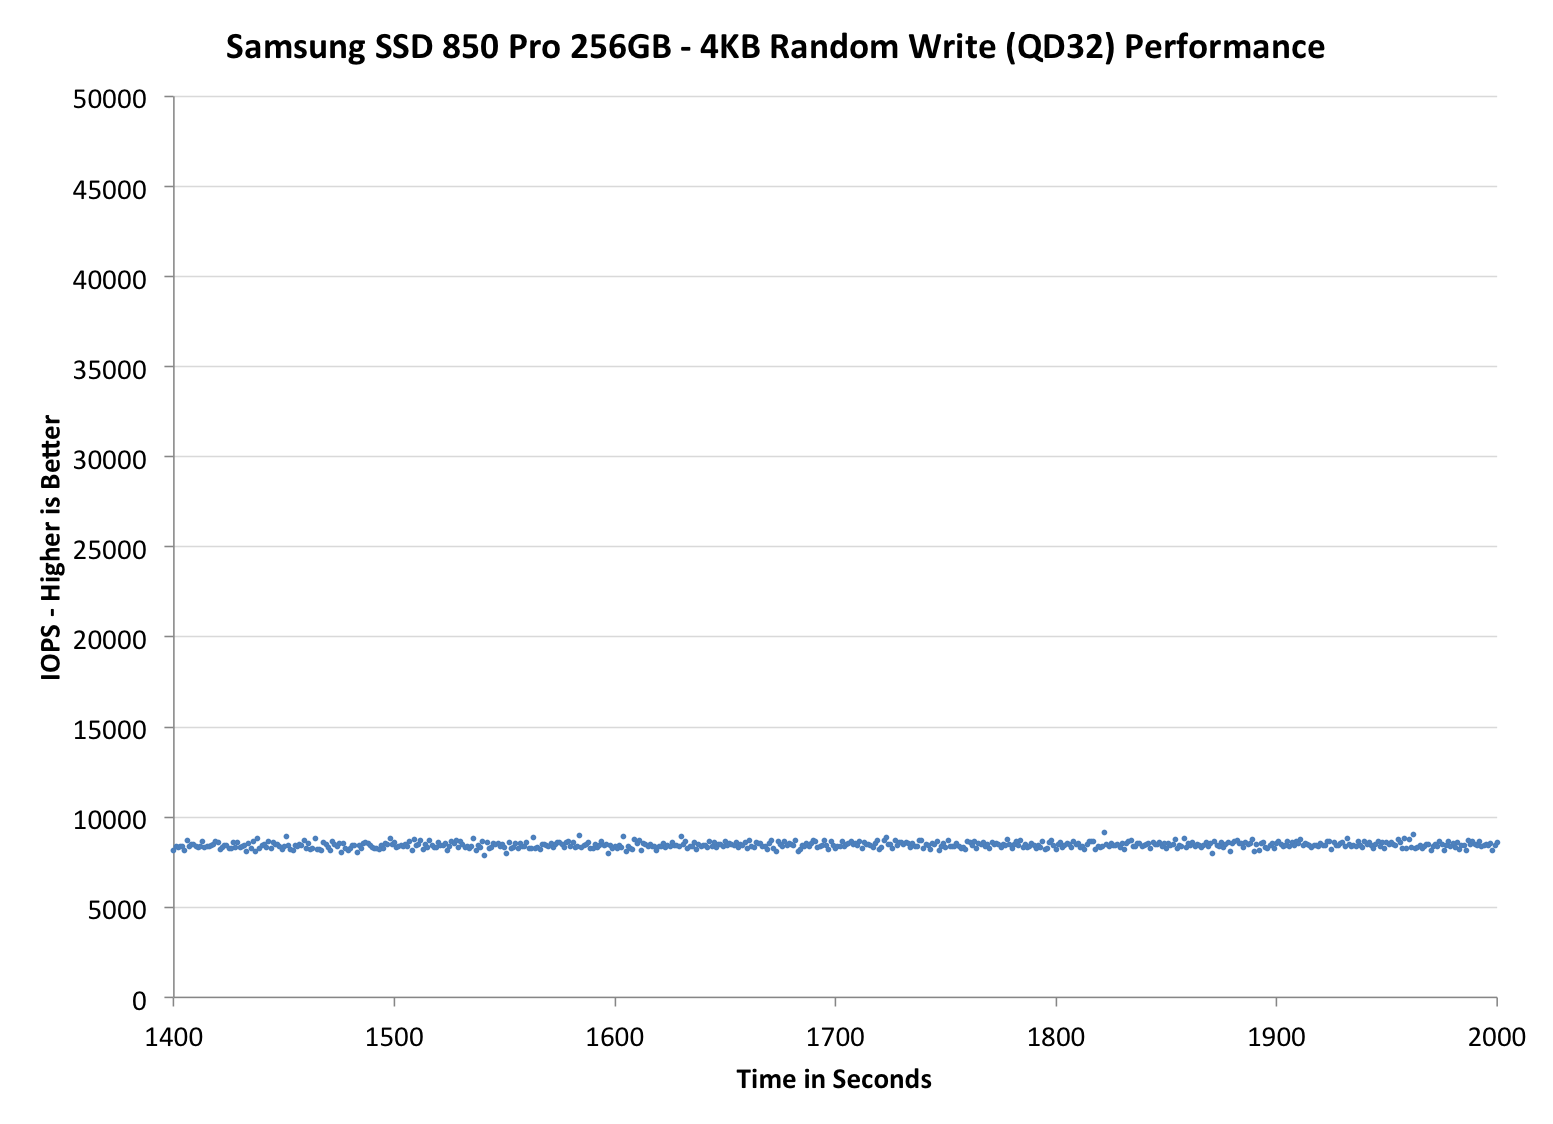
Each of the three graphs has its own purpose. The first one is of the whole duration of the test in log scale. The second and third one zoom into the beginning of steady-state operation (t=1400s) but on different scales: the second one uses log scale for easy comparison whereas the third one uses linear scale for better visualization of differences between drives. Click the buttons below each graph to switch the source data.
For more detailed description of the test and why performance consistency matters, read our original Intel SSD DC S3700 article.
 |
|||||||||
| Samsung SSD 850 Pro | Samsung SSD 840 Pro | SanDisk Extreme Pro | Intel SSD 730 | OCZ Vector 150 | |||||
| 7% Over-Provisioning | - | - | - | ||||||
| 12% Over-Provisioning | |||||||||
| 25% Over-Provisioning | |||||||||
Wow, this is awesome. Even with the default 7% over-provisioning, the 850 Pro is pushing almost as many IOPS as the Extreme Pro with its 12% over-provisioning. When the over-provisioning is increased to the same 12% level, the 850 Pro is a leader without a doubt. Only the Vector 150 can come close, although it is nowhere hear as constant as the IOPS is ranging between 10K and 30K, whereas the 850 Pro can maintain a steady line.
When compared with the 840 Pro, the upgrade is tremendous. IO consistency was always the weak point of the 840 Pro, so it is great to see that Samsung has paid a great effort to fix that in the 850 Pro. A part of the performance increase obviously comes from the usage of V-NAND because with shorter program and erase latencies, the steady-state performance increases as the garbage collection takes less time and there are more empty blocks available.
Some of you may wonder the odd capacities at 25% over-provisioning but the reason is that I noticed an error in the old ones. Basically, the old 25% numbers were in gibibytes (i.e. 1024^3 bytes) whereas the other capacities have always been in gigabytes (1000^3 bytes). I decided to unify the capacities and now they are all reported in gigabytes. The actual testing or over-provisioning levels have not changes -- it is simply a matter of how the capacities are represented.
 |
|||||||||
| Samsung SSD 850 Pro | Samsung SSD 840 Pro | SanDisk Extreme Pro | Intel SSD 730 | OCZ Vector 150 | |||||
| 7% Over-Provisioning | - | - | - | ||||||
| 12% Over-Provisioning | |||||||||
| 25% Over-Provisioning | |||||||||
 |
|||||||||
| Samsung SSD 850 Pro | Samsung SSD 840 Pro | SanDisk Extreme Pro | Intel SSD 730 | OCZ Vector 150 | |||||
| 7% Over-Provisioning | - | - | - | ||||||
| 12% Over-Provisioning | |||||||||
| 25% Over-Provisioning | |||||||||


160 Comments
View All Comments
alacard - Monday, June 30, 2014 - link
Fascinating stuff, thanks for the in depth analysis.Iketh - Tuesday, July 1, 2014 - link
Good read on the software not taking advantage of SSDs yet. Windows is the biggest offender. I have 8 threads and an SSD and I still have to wait for each of my startup programs to load like a snail 1 at a time after bootup...tetsuo77 - Monday, June 30, 2014 - link
"There are some drops, although I am not sure what is causing them"It looks suspiciously like your values overflowed an unsigned int (prior to being converted from B to KB). Just add ~4.3 million to the 4 mysteriously low values and you have a nicely shaped curve.
tetsuo77 - Monday, June 30, 2014 - link
Oops.. I pasted the wrong quote. Meant to quote this: "It looks like read performance scales quite linearly until hitting the IO size of 256KB where RAPID stops caching"I maintain that there is an error in the numbers on the graph :)
Gigaplex - Tuesday, July 1, 2014 - link
32 bit unsigned integers support around 4.3 billion, not million.lyeoh - Friday, July 4, 2014 - link
if the values were being stored internally as bytes and not kilobytes it might overflow as tetsuo77 mentioned. 4.3 million * kilobytes per sec = billions of bytes/sec which could overflow.nirwander - Monday, June 30, 2014 - link
I cant see how they aim at mainstream with these prices.Crucial MX100 512 is already fast enough for SATA 6 Gbps and.. twice as cheap!
Technology geeks will probaly go for Intel PCIe NVMe drives.
Gigaplex - Monday, June 30, 2014 - link
And if you really need the performance, just get two of the MX100s and RAID 0 them.willis936 - Tuesday, July 1, 2014 - link
Unless you care about storage latency at all.Gigaplex - Tuesday, July 1, 2014 - link
Fair point, but SSDs are so far ahead of hard drives in terms of latency that it hardly matters.