Samsung SSD 850 Pro (128GB, 256GB & 1TB) Review: Enter the 3D Era
by Kristian Vättö on July 1, 2014 10:00 AM ESTPerformance Consistency
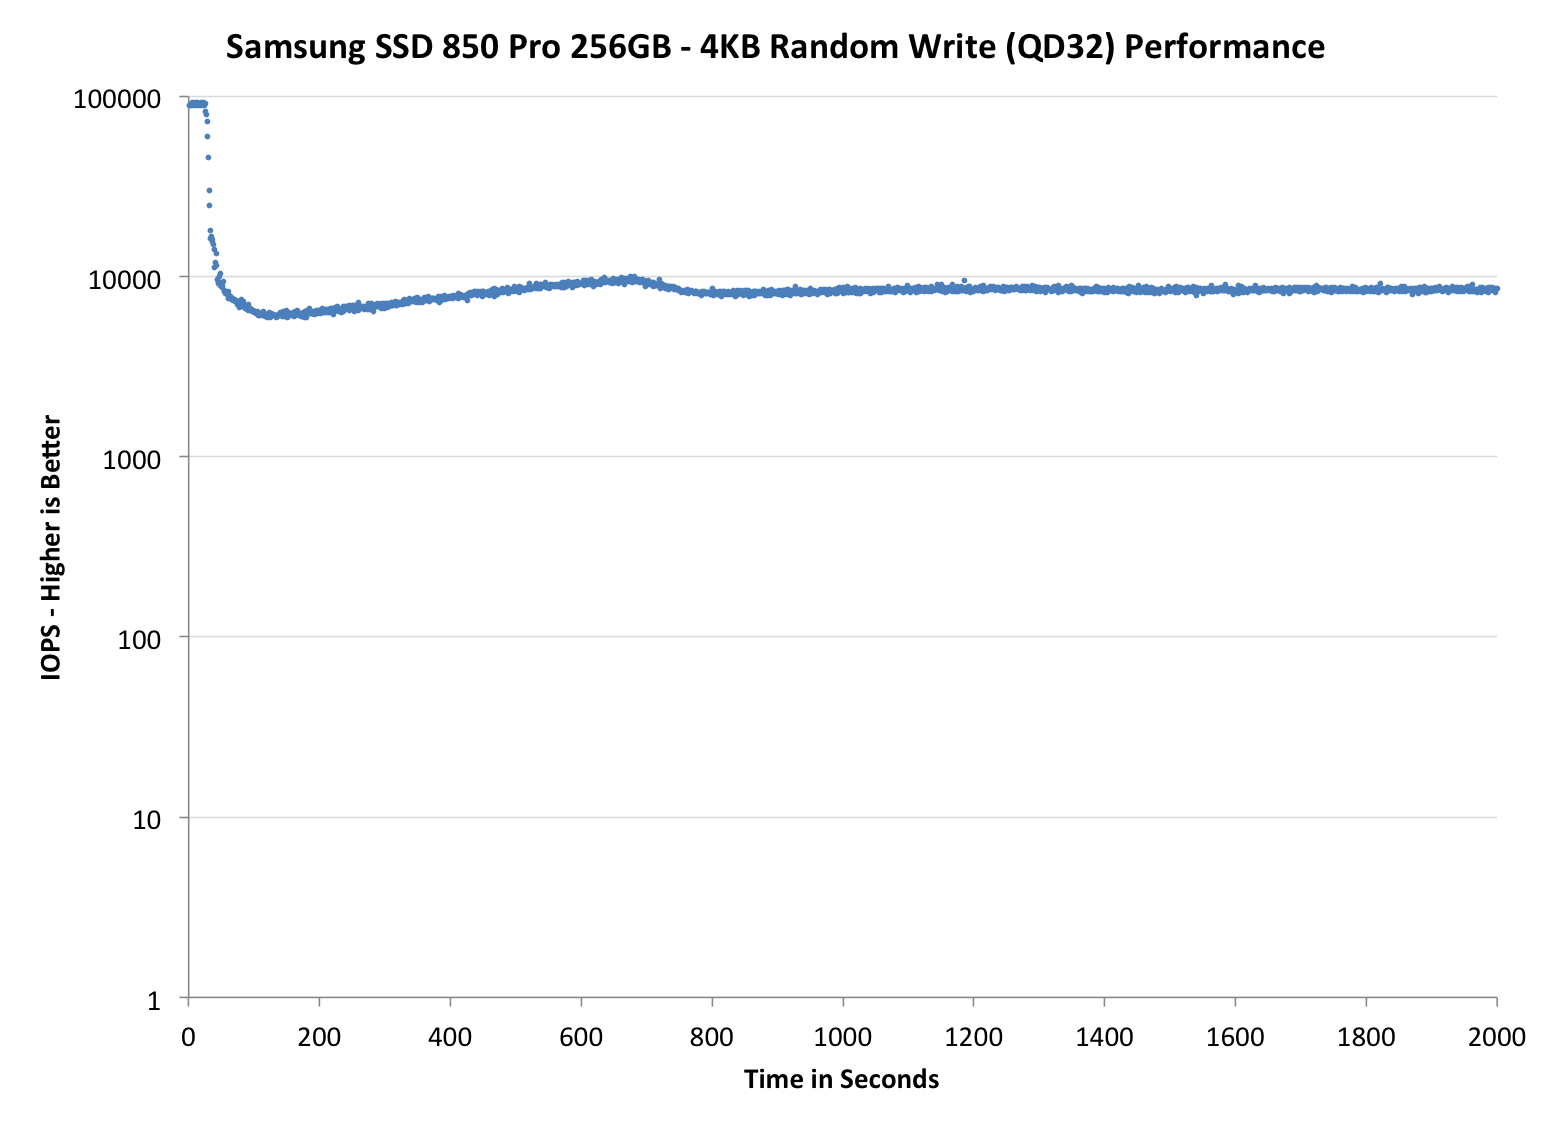
Performance consistency tells us a lot about the architecture of these SSDs and how they handle internal defragmentation. The reason we don’t have consistent IO latency with SSD is because inevitably all controllers have to do some amount of defragmentation or garbage collection in order to continue operating at high speeds. When and how an SSD decides to run its defrag or cleanup routines directly impacts the user experience as inconsistent performance results in application slowdowns.
To test IO consistency, we fill a secure erased SSD with sequential data to ensure that all user accessible LBAs have data associated with them. Next we kick off a 4KB random write workload across all LBAs at a queue depth of 32 using incompressible data. The test is run for just over half an hour and we record instantaneous IOPS every second.
We are also testing drives with added over-provisioning by limiting the LBA range. This gives us a look into the drive’s behavior with varying levels of empty space, which is frankly a more realistic approach for client workloads.
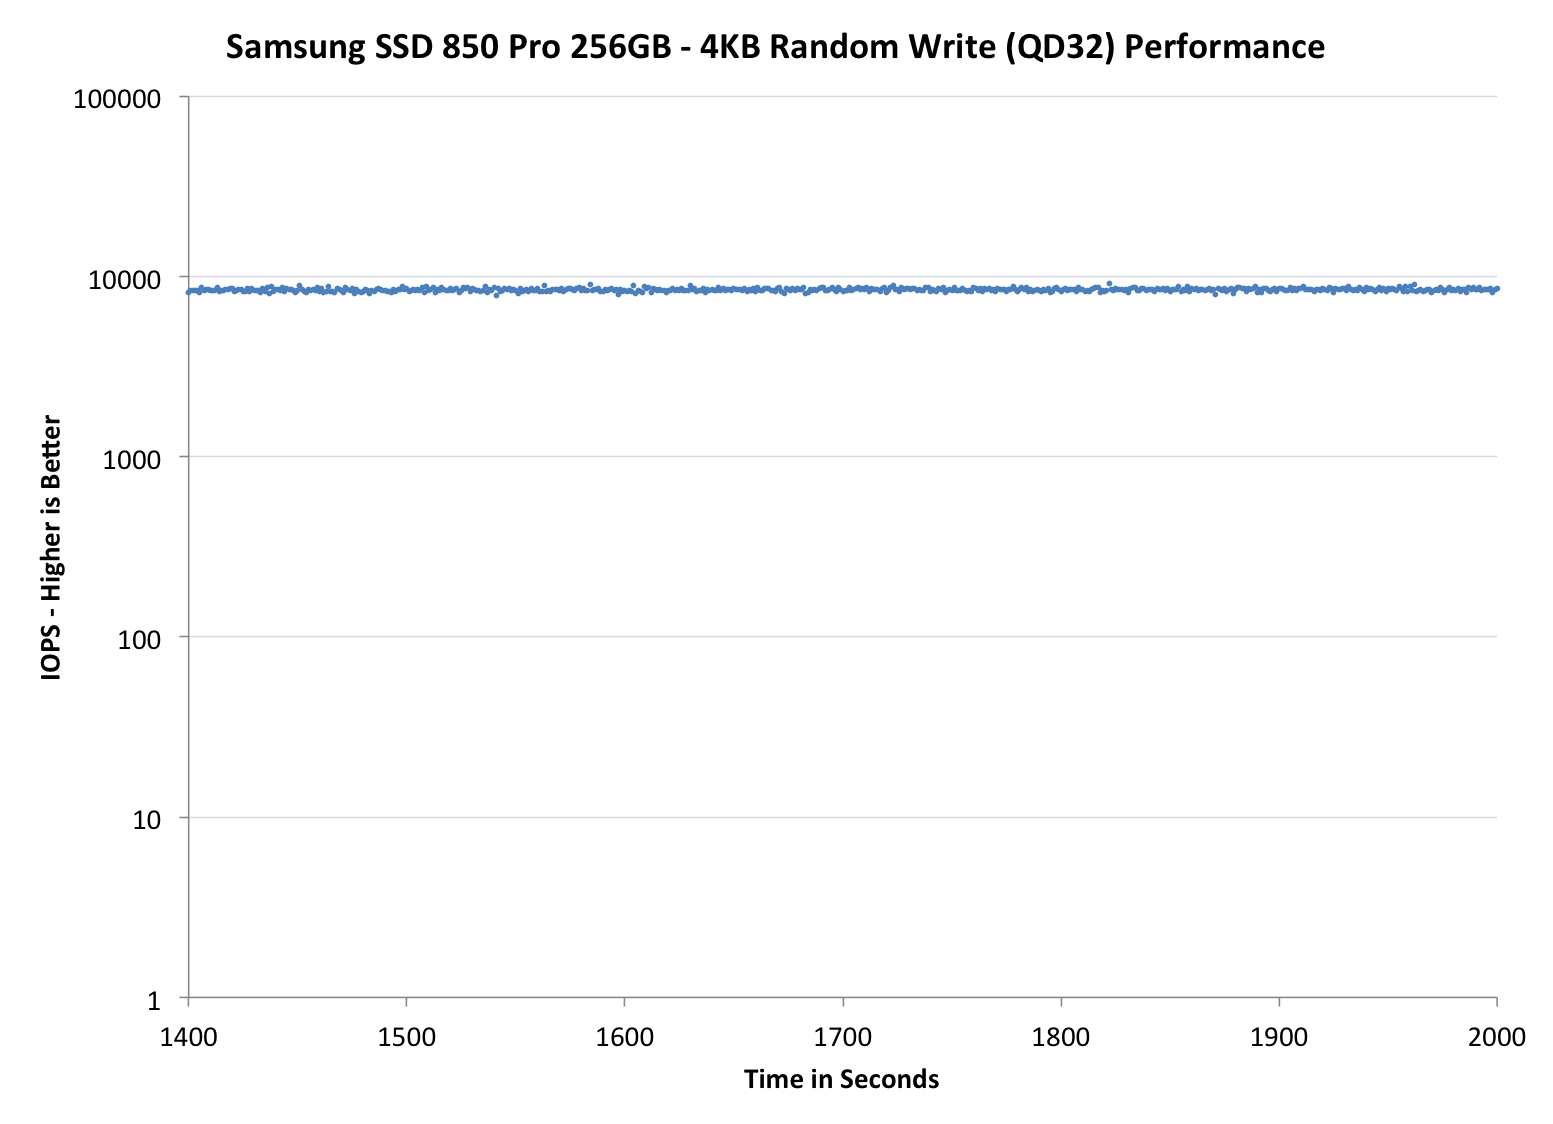
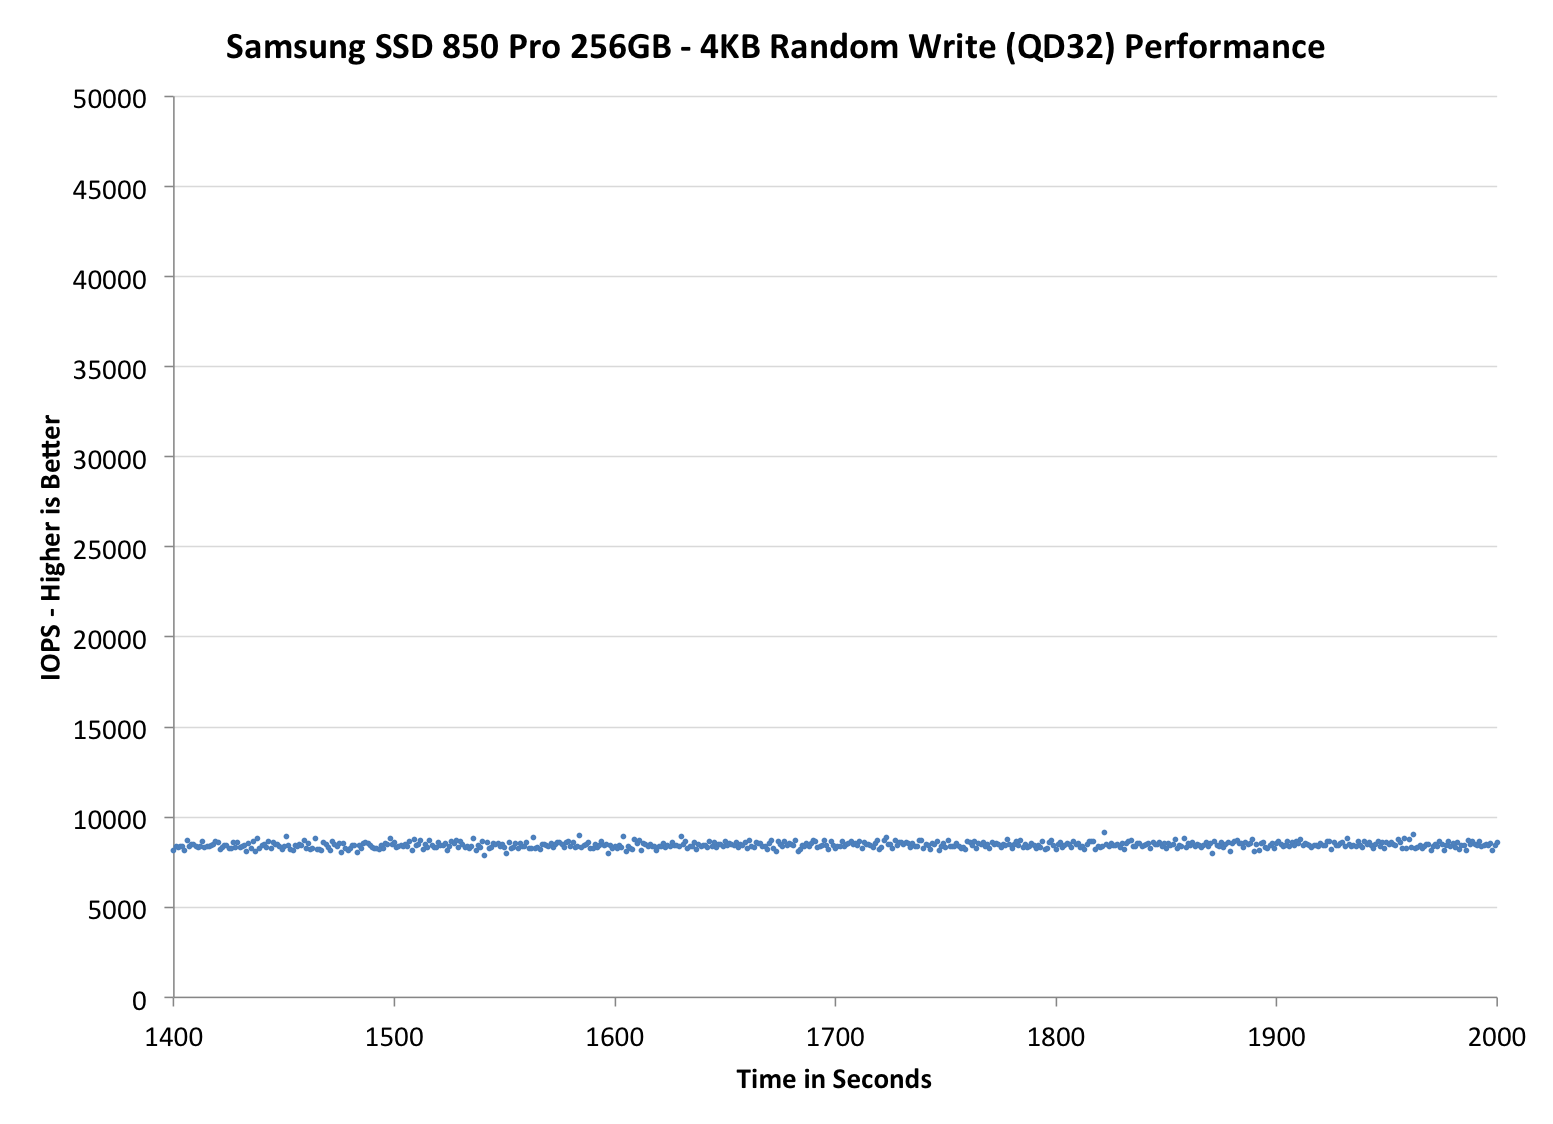
Each of the three graphs has its own purpose. The first one is of the whole duration of the test in log scale. The second and third one zoom into the beginning of steady-state operation (t=1400s) but on different scales: the second one uses log scale for easy comparison whereas the third one uses linear scale for better visualization of differences between drives. Click the buttons below each graph to switch the source data.
For more detailed description of the test and why performance consistency matters, read our original Intel SSD DC S3700 article.
 |
|||||||||
| Samsung SSD 850 Pro | Samsung SSD 840 Pro | SanDisk Extreme Pro | Intel SSD 730 | OCZ Vector 150 | |||||
| 7% Over-Provisioning | - | - | - | ||||||
| 12% Over-Provisioning | |||||||||
| 25% Over-Provisioning | |||||||||
Wow, this is awesome. Even with the default 7% over-provisioning, the 850 Pro is pushing almost as many IOPS as the Extreme Pro with its 12% over-provisioning. When the over-provisioning is increased to the same 12% level, the 850 Pro is a leader without a doubt. Only the Vector 150 can come close, although it is nowhere hear as constant as the IOPS is ranging between 10K and 30K, whereas the 850 Pro can maintain a steady line.
When compared with the 840 Pro, the upgrade is tremendous. IO consistency was always the weak point of the 840 Pro, so it is great to see that Samsung has paid a great effort to fix that in the 850 Pro. A part of the performance increase obviously comes from the usage of V-NAND because with shorter program and erase latencies, the steady-state performance increases as the garbage collection takes less time and there are more empty blocks available.
Some of you may wonder the odd capacities at 25% over-provisioning but the reason is that I noticed an error in the old ones. Basically, the old 25% numbers were in gibibytes (i.e. 1024^3 bytes) whereas the other capacities have always been in gigabytes (1000^3 bytes). I decided to unify the capacities and now they are all reported in gigabytes. The actual testing or over-provisioning levels have not changes -- it is simply a matter of how the capacities are represented.
 |
|||||||||
| Samsung SSD 850 Pro | Samsung SSD 840 Pro | SanDisk Extreme Pro | Intel SSD 730 | OCZ Vector 150 | |||||
| 7% Over-Provisioning | - | - | - | ||||||
| 12% Over-Provisioning | |||||||||
| 25% Over-Provisioning | |||||||||
 |
|||||||||
| Samsung SSD 850 Pro | Samsung SSD 840 Pro | SanDisk Extreme Pro | Intel SSD 730 | OCZ Vector 150 | |||||
| 7% Over-Provisioning | - | - | - | ||||||
| 12% Over-Provisioning | |||||||||
| 25% Over-Provisioning | |||||||||


160 Comments
View All Comments
emvonline - Tuesday, July 1, 2014 - link
is the die size for the NAND chip 67mm^2? I assumed you measured it (pretty easy to do). I would think it would be much larger than thatGigaplex - Tuesday, July 1, 2014 - link
It's difficult to measure the die when multiple of them are on the same package.emvonline - Tuesday, July 1, 2014 - link
send me the package... I promise to have exact die size in a week ..... TEM cross sections in two weeks :-)Kristian Vättö - Tuesday, July 1, 2014 - link
Send me an email at kristian@anandtech.com and let's work this out :)extide - Tuesday, July 1, 2014 - link
Yes, 67mm^2, but remember that is 32 "deep"emvonline - Tuesday, July 1, 2014 - link
@extide: so you measured the die to be 67mm^2? how was this measured ? CSAM? XRAY? that seems odd to use such a small dies for SSD. and that would make it even smaller cell size than the one at ISSCC since it was 134 for a 128Gbit with 24 layers (periphery doesnt shrink as fast with lower density)Kristian Vättö - Tuesday, July 1, 2014 - link
No I didn't because I don't have the equipment to do that. The method I used to calculate the die size is explained on the fifth page of the review:http://www.anandtech.com/show/8216/samsung-ssd-850...
I'm not claiming that it is an accurate figure, hence the "~" sign in front of it. However, Samsung wouldn't disclose the die size when I asked them during the Q&A, so at this point I don't know for sure. However, I have a picture of the 32-layer wafer and once I get back home I'll do the math of the wafer to figure out the exact die size.
emvonline - Tuesday, July 1, 2014 - link
Got it thanks. I am mainly wondering about redundancy, extra blocks and ECC overhead.drwho9437 - Tuesday, July 1, 2014 - link
The micrograph you say is an "x-ray", is almost certainly a transmission electron microscopy image. Given the oxides are light it is a bright field image. It could technically be a SEM image but the resolution is a bit to high, so it most likely is a STEM image with a bright field detector.GTVic - Tuesday, July 1, 2014 - link
Perhaps time should be added as a cost efficiency factor. Presumably the die has to stay in the process much longer due to all the layers being added one at a time.