ADATA Premier SP610 SSD (256GB & 512GB) Review: Say Hello to an SMI Controller
by Kristian Vättö on June 27, 2014 2:00 PM EST- Posted in
- Storage
- SSDs
- ADATA
- SP610
- Silicon Motion
AnandTech Storage Bench 2013
Our Storage Bench 2013 focuses on worst-case multitasking and IO consistency. Similar to our earlier Storage Benches, the test is still application trace based - we record all IO requests made to a test system and play them back on the drive we are testing and run statistical analysis on the drive's responses. There are 49.8 million IO operations in total with 1583.0GB of reads and 875.6GB of writes. I'm not including the full description of the test for better readability, so make sure to read our Storage Bench 2013 introduction for the full details.
| AnandTech Storage Bench 2013 - The Destroyer | ||
| Workload | Description | Applications Used |
| Photo Sync/Editing | Import images, edit, export | Adobe Photoshop CS6, Adobe Lightroom 4, Dropbox |
| Gaming | Download/install games, play games | Steam, Deus Ex, Skyrim, Starcraft 2, BioShock Infinite |
| Virtualization | Run/manage VM, use general apps inside VM | VirtualBox |
| General Productivity | Browse the web, manage local email, copy files, encrypt/decrypt files, backup system, download content, virus/malware scan | Chrome, IE10, Outlook, Windows 8, AxCrypt, uTorrent, AdAware |
| Video Playback | Copy and watch movies | Windows 8 |
| Application Development | Compile projects, check out code, download code samples | Visual Studio 2012 |
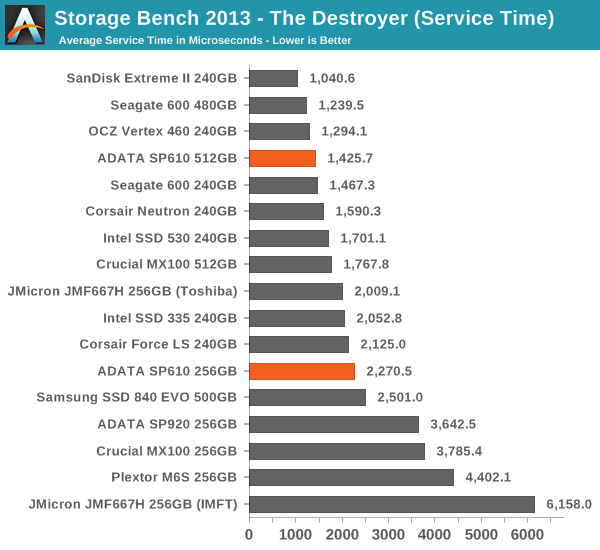
We are reporting two primary metrics with the Destroyer: average data rate in MB/s and average service time in microseconds. The former gives you an idea of the throughput of the drive during the time that it was running the test workload. This can be a very good indication of overall performance. What average data rate doesn't do a good job of is taking into account response time of very bursty (read: high queue depth) IO. By reporting average service time we heavily weigh latency for queued IOs. You'll note that this is a metric we have been reporting in our enterprise benchmarks for a while now. With the client tests maturing, the time was right for a little convergence.
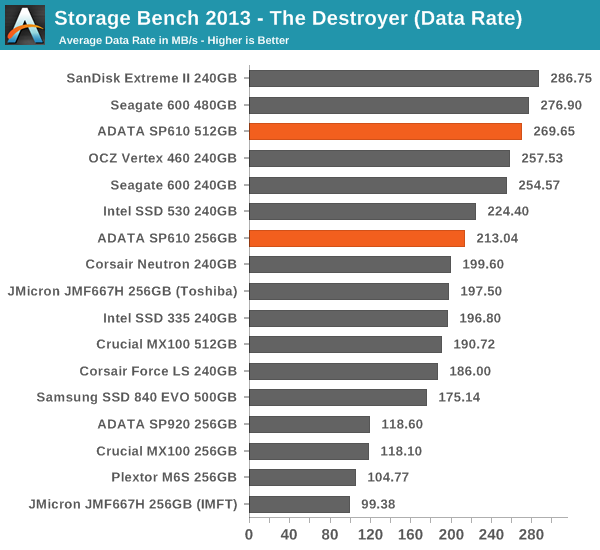
Well, this doesn't make much sense. The service times aren't anything special, yet the average data rate is surprisingly high. For instance the 256GB JMF667H drive has lower service time but the average data rate is lower.
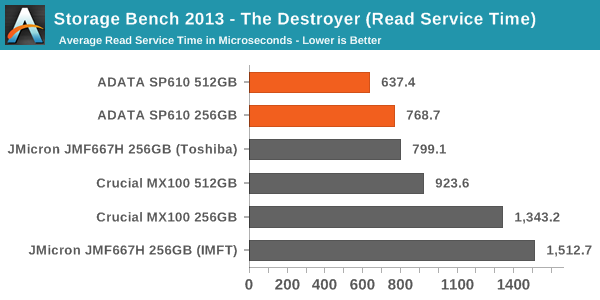
For this to make some sense, let's look at the service times for reads and writes separately.
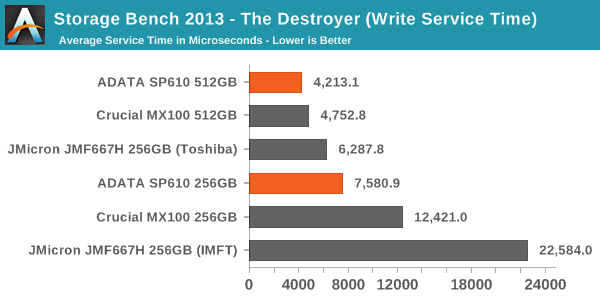
Now this makes more sense. Due to the relatively poor IO consistency of the SP610, the write service times are quite high. That increases the average service time substantially but the impact on average data rate is smaller, and the reason for that is quite simple.
To keep thing simple, imagine that it takes five seconds to write 128KB of sequential data and one second to write 4KB of random data. In other words, it takes six seconds to write 132KB of data, which works out to be 22KB/s. However, the 128KB write operation completed at 25.6KB/s, whereas the throughput of the 4KB write operation was only 4KB/s. 22KB/s is certainly much closer to 25.6KB/s than 4KB/s, meaning that the average data rate gives more emphasis to the large transfer because frankly it counts more when looking at amount of data that was transferred.
But now add in the service time. It took a total of six seconds to complete two IOs, which means that the average service time is three seconds. It doesn't matter that the other IO is much larger because service time only looks at the completion time of an IO, regardless of its size. Because of that, the service times give more information about small IO performance than the average data rate where the small IOs are buried under the larger transfers.
In the context of the SP610, this means that it performs well with large IOs as the data rate is high. Only about 30% of the IOs in the trace are 4KB, whereas 40% are 64KB and 20% are 128KB. With small IOs the performance is not bad but for instance the JMF667H does slightly better, resulting in lower service times. Despite the mediocre performance consistency on the previous page, overall the SP610 does very well in the 2013 Storage Bench and potentially offers users better performance than the MX100, 840 EVO and JMF667H.


24 Comments
View All Comments
skiboysteve - Sunday, June 29, 2014 - link
Very very cool. Thanks for sharingshodanshok - Sunday, June 29, 2014 - link
Really interesting. How can we help in benchmarking?smadhu - Sunday, June 29, 2014 - link
WE are trying to get a benchmarking setup on a Zync zedboard card first. It is a partially simulated environment. That PCIe and the NAND flash are simulated using RAM but the controller and the CPU is the actual IP. Most universities want this setup first since it assumes an infinite source and sink and let you tune the protocol and the controller.We will also simultaneously release using the Xilinx AC701 card. This is a PCIe card but has no bulitin NAND modules. We are working with Xilinx to get a NAND module done ASAP. But even without it at lease the env. get more real in the sense that now the IP and PCIe are actual IP and only NAND is simulated.
Once proven on this card, we are creating a dedicated PCIe SSD card that will also be open sourced. That will a full fledged card with user replaceable NAND modules and will also be cost optimized. Hopefully Asian vendors will clone those in large quantities to being down cost. We neither charge any royalty nor do we apply for patents on an of our IP. Since the NAND modules are standard, we hope to create a 3rd party eco-system for NAND modules. So you can upgrade your PCIe card when you run out of storage space or when new NAND tech is available.
This effort is actually kind of a trojan horse for our larger project, the SHAKTI open source CPU. We have about 6 classes/families of CPU being developed, ranging from Cortex M-3 level microcontrollers to Xeon class 16-24 core server parts. HPC variants will have 512 bit SIMD with 64-100 cores (NoC fabric). All BSD licensed open source of course. We are running GCC on the cores now and wrapping up SoC integration for the lower end cores. Hope to get Linux running by Christmas. Low end target is the Diglinet Nexus 4 FPGA board
Th cores are important for Storage since we allows us to do the following
- modify the ISA for storage specific operations and remove instructions that is not needed for storage
- allow user defined code to run on the storage controllers
- add functional units for database acceleration
All SoC integration is via AXI framework, so vendors can easily use this IP without retraining their engineers. WE are not alone in such cores, Cambridge just released their MIPS compatible secure CPU.
see beri-cpu.org.
UCB will also shortly release its full blown cores.
Somebody asked me why we did such massive open source HW IP without expecting monetary returns. My answer was simple, I could either build a billion dollar startup or remove a few billion dollars from the IP market ! I chose the latter !
Beagus - Monday, June 30, 2014 - link
Page one Table MB/GB/TB.As always - Good work