The Intel SSD DC P3700 Review Part 2: NVMe on Client Workloads
by Anand Lal Shimpi on June 10, 2014 12:07 AM EST- Posted in
- Storage
- SSDs
- Intel
- Intel SSD DC P3700
- NVMe
Last week we reviewed Intel's first NVMe drive: the DC P3700. Based on a modified version of the controller in Intel's SSD DC S3700/S3500, the P3700 moves to an 18-channel design, drops internal latencies and sheds SATA for a native PCIe interface. The result is an extremely high performance enterprise SSD that delivers a combination of high bandwidth and very low latencies, across a wide span of queue depths.
Although Intel's SSD DC P3700 is clearly targeted at the enterprise, the drive will be priced quite aggressively at $3/GB. Furthermore, Intel will be using the same controller and firmware architecture in two other, lower cost derivatives (P3500/P3600). In light of Intel's positioning of the P3xxx family, a number of you asked for us to run the drive through our standard client SSD workload. We didn't have the time to do that before Computex, but it was the first thing I did upon my return. If you aren't familiar with the P3700 I'd recommend reading the initial review, but otherwise let's look at how it performs as a client drive.


Performance Consistency
Performance consistency tells us a lot about the architecture of these SSDs and how they handle internal defragmentation. The reason we don’t have consistent IO latency with SSD is because inevitably all controllers have to do some amount of defragmentation or garbage collection in order to continue operating at high speeds. When and how an SSD decides to run its defrag or cleanup routines directly impacts the user experience as inconsistent performance results in application slowdowns.
To test IO consistency, we fill a secure erased SSD with sequential data to ensure that all user accessible LBAs have data associated with them. Next we kick off a 4KB random write workload across all LBAs at a queue depth of 32 using incompressible data. The test is run for just over half an hour and we record instantaneous IOPS every second.
We are also testing drives with added over-provisioning by limiting the LBA range. This gives us a look into the drive’s behavior with varying levels of empty space, which is frankly a more realistic approach for client workloads.
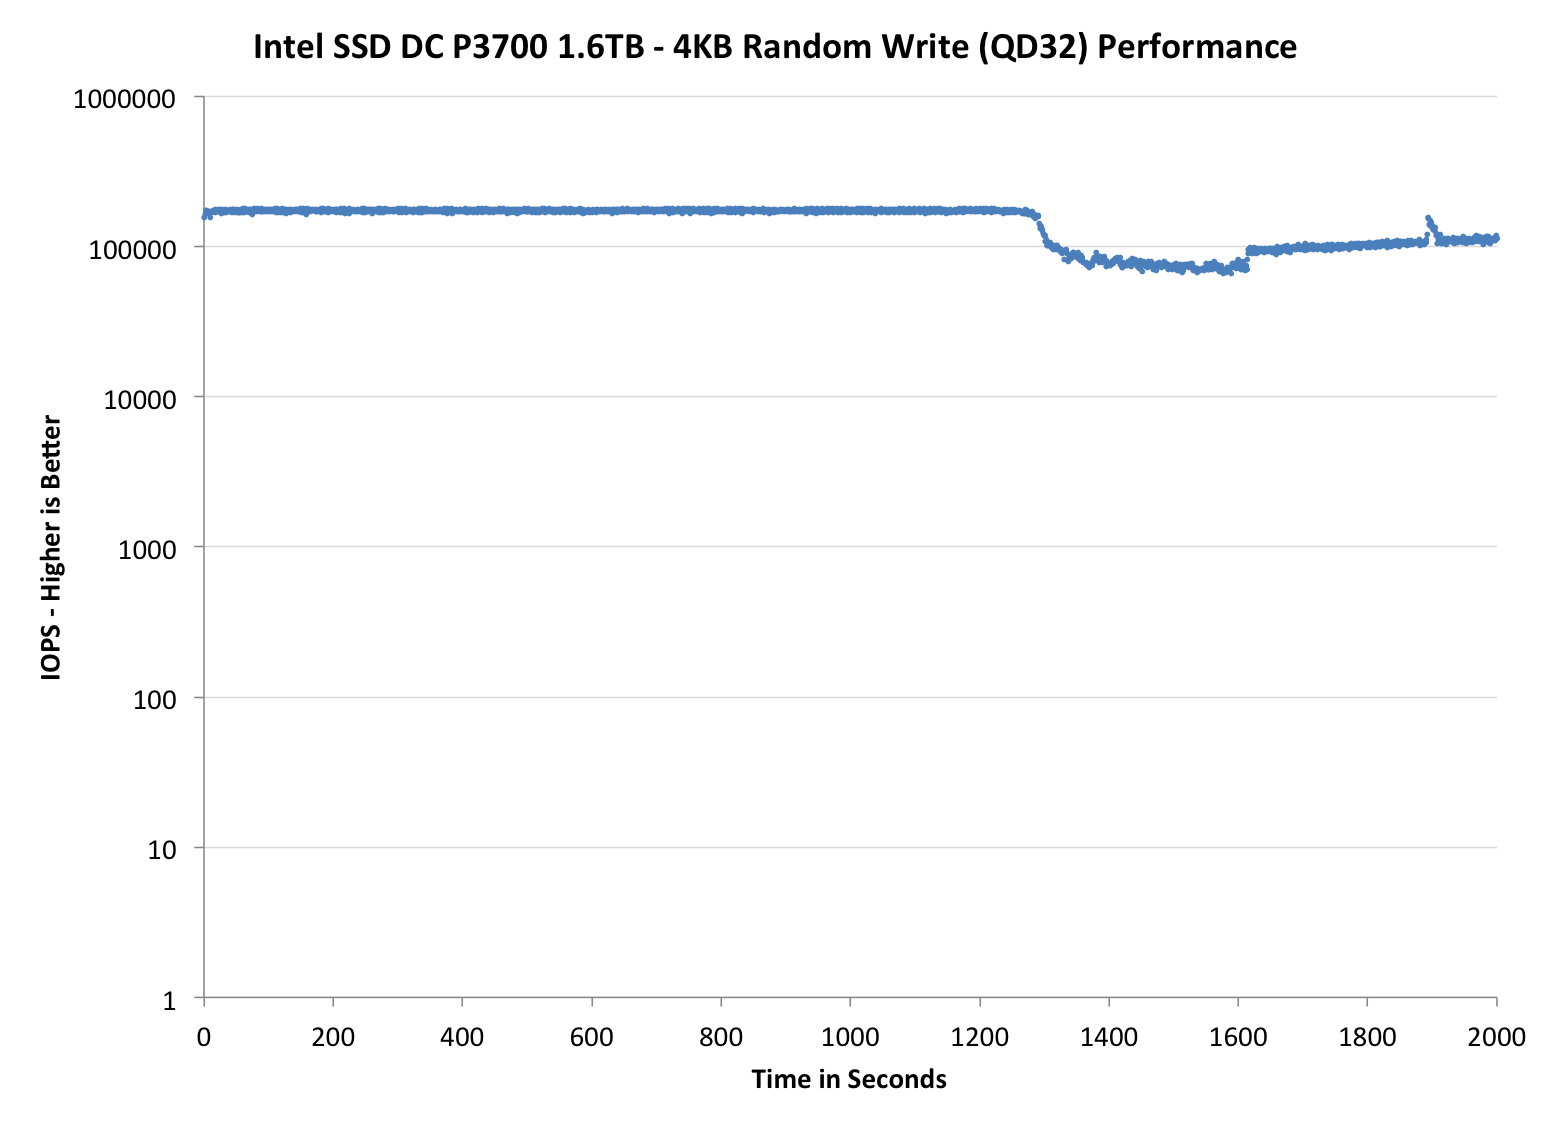
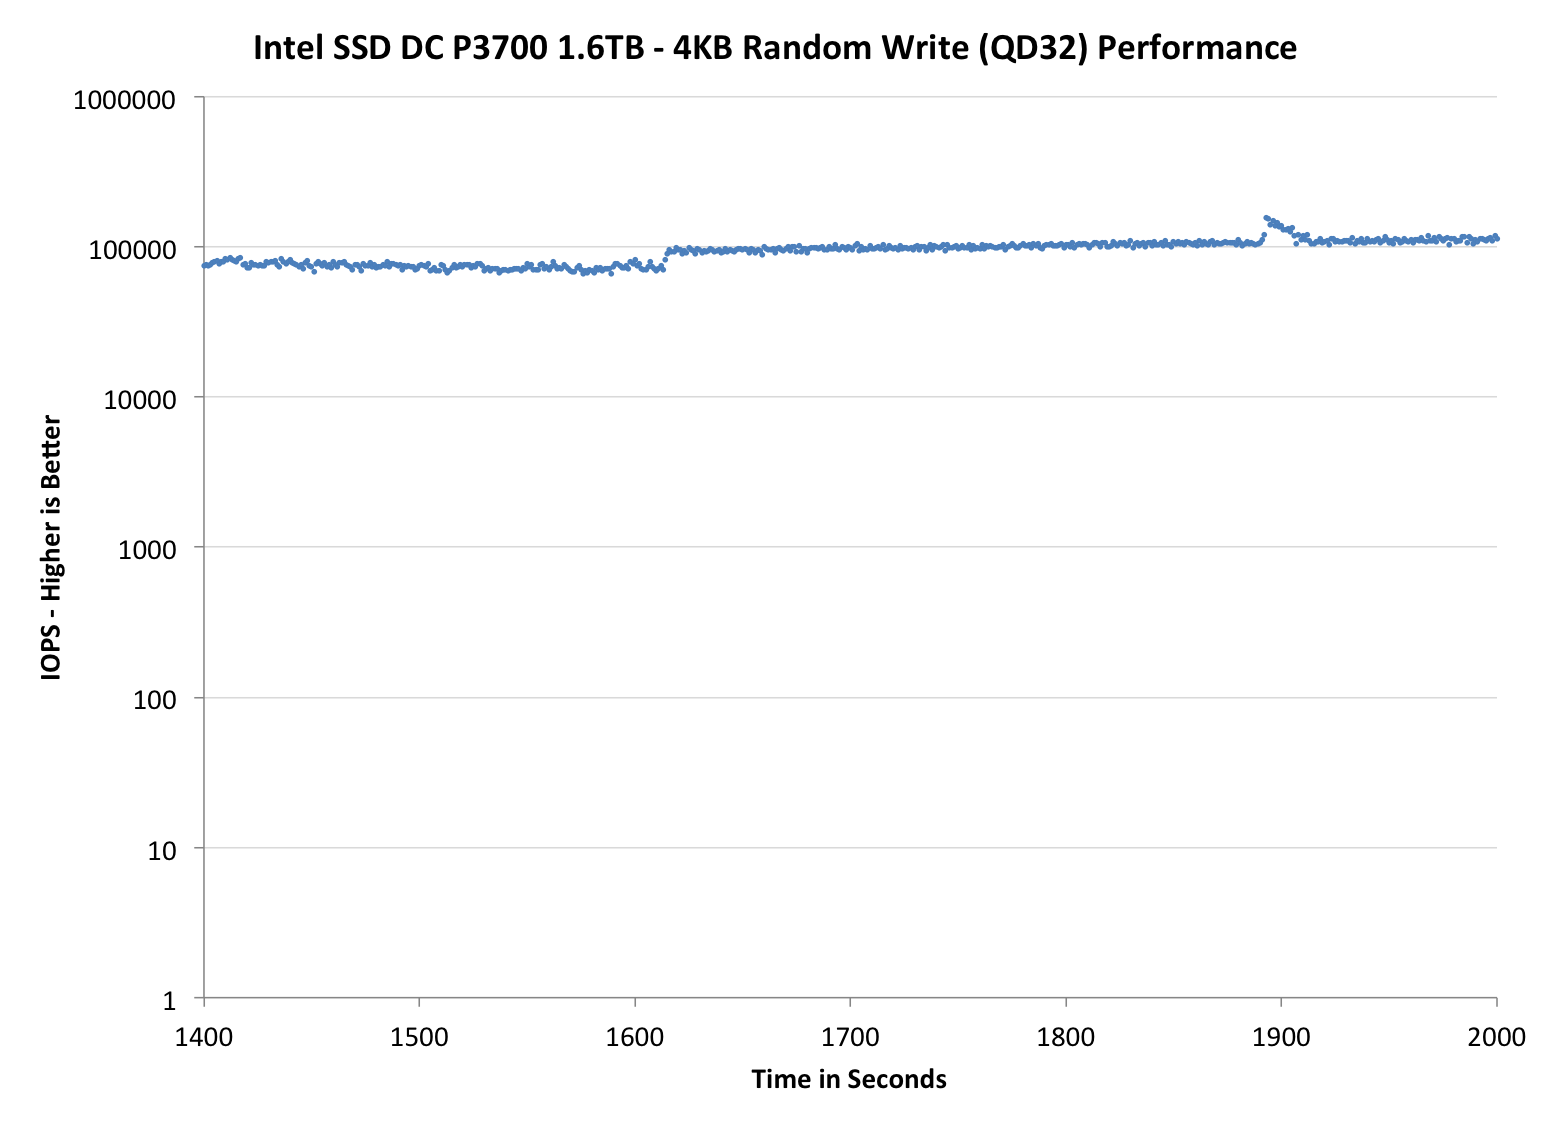
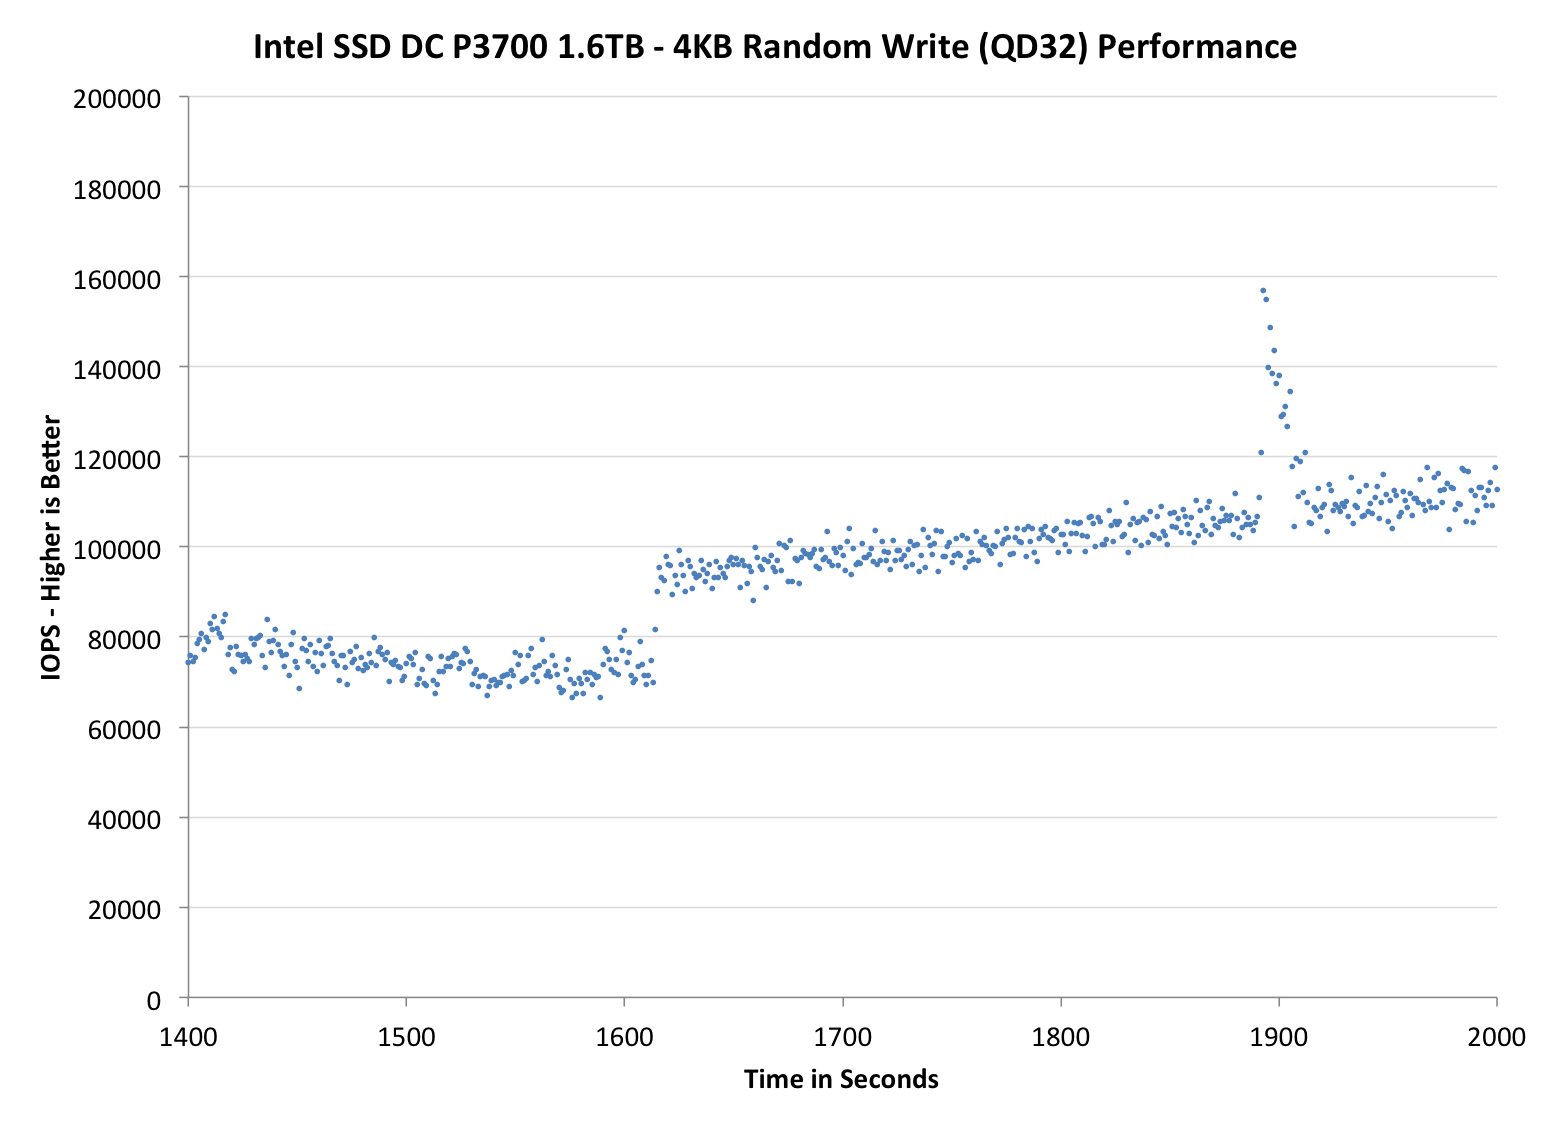
Each of the three graphs has its own purpose. The first one is of the whole duration of the test in log scale. The second and third one zoom into the beginning of steady-state operation (t=1400s) but on different scales: the second one uses log scale for easy comparison whereas the third one uses linear scale for better visualization of differences between drives. Click the buttons below each graph to switch the source data.
For more detailed description of the test and why performance consistency matters, read our original Intel SSD DC S3700 article.
 |
|||||||||
| Intel SSD DC P3700 | Intel SSD DC S3700 | Samsung SSD 840 Pro | SanDisk Extreme II | Samsung SSD XP941 | |||||
| Default | |||||||||
| 25% Spare Area | |||||||||
In our enterprise P3700 review we looked at IO consistency during a multi-hour run of a 4KB random write test at a queue depth of 128. The P3700 did quite well in that test, but the results weren't exactly comparable to what we've run for the past 18+ months. Here I ran the same QD32 test on the P3700, and the results are even better than the S3700. Keep in mind that the scales aren't comparable between the two drives (the P3700's higher performance drives the scale up to 1M IOPS), but the P3700 shows a very small drop in performance once the drive is out of spare area.
 |
|||||||||
| Intel SSD DC P3700 | Intel SSD DC S3700 | Samsung SSD 840 Pro | SanDisk Extreme II | Samsung SSD XP941 | |||||
| Default | |||||||||
| 25% Spare Area | |||||||||
 |
|||||||||
| Intel SSD DC P3700 | Intel SSD DC S3700 | Samsung SSD 840 Pro | SanDisk Extreme II | Samsung SSD XP941 | |||||
| Default | |||||||||
| 25% Spare Area | |||||||||
There's definitely some tweaking to the S3700's controller/firmware as the P3700 shows a much longer period of stable performance before there's a drop and recovery.


36 Comments
View All Comments
[-Stash-] - Tuesday, June 10, 2014 - link
Will be great to see how the 35 and 36 perform in the client workloads – really quite excited about these.romrunning - Tuesday, June 10, 2014 - link
In the 25% OP 4KB Random Write (QD32) graph, the Samsung XP941 showed a massive drop between its 512GB and 384GB (25% spare area) results. From 30k down to 5k - is that an anomaly?Also, what's with the vertical scale showing 1, 10, and 100 ranges? That forces all of the data points into a much smaller range, and it's visually not as informative.
Kristian Vättö - Tuesday, June 10, 2014 - link
Are you sure you are not mixing up the graphs? With 25% spare area, the results are better (~30K IOPS), which is how things should be.romrunning - Tuesday, June 10, 2014 - link
I see - the two charts on the bottom of page one are same but with different vertical scales (as explained so well by DanNeely below).Yes, I suppose instead of calling it a drop, you could say it's actually a rise from 5k to 30k IOPs when you go 25% spare area. It seems Samsung drives especially like extra spare area.
DanNeely - Tuesday, June 10, 2014 - link
It's called a log scale; and generally is the better choice when you've got values spanning more than 2 or 3 orders of magnitude (ie more than 100x or 1000x). A linear scale would crush everything but the largest values into a tiny area at the bottom. With the highly consistent performance of the DC P3700 it's not as big a concern; but with the less consistent behavior of most consumer or older enterprise drives it's the only good way to see the behavior. Look at the Samsung 840; it has peak IOPS of ~100,000; drops to a steady state behavior mostly between ~3000-9000 but with occasional excursions as low as ~110.Also, the tests are being done to show consistency of performance, a log scale makes seeing that much easier because the same vertical distance between min and max always represents the same multiple (eg 2x 3x 10x) between the values; a linear scale would mask inconsistency in slower drives while exaggerating it in higher performing ones because because 20000-22000 is a much larger interval on a linear scale than 10-1000 despite the former being a highly consistent drive with 10% variation and the latter having a 100x variation.
ryanjacoby2 - Tuesday, June 10, 2014 - link
I'm enjoying the pivotchart type graphs you guys transitioned to a while ago. Makes readability and comparisons a breeze without the clutter, thanks for the change!uruturu - Tuesday, June 10, 2014 - link
why don't you test the same drives also with 25% OP in storage bench 2013?samsung 840 pro (25% OP) vs sandisk extreme II (25% OP)...factory settings seem to penalize some drives.
morganf - Tuesday, June 10, 2014 - link
I thought the same thing. The 2013 storage bench writes an insane amount of data in a short time. If someone really cares about performance with such a heavy write-load, then they would certainly overprovision their SSD. The P3700 obviously already comes from the factory with a lot of OP. It only makes sense to also OP the Samsung 840 Pro and other drives, as a point of comparison, when running the 2013 Storage bench.To be clear, I mean to run the 2013 Storage Bench on each SSD with and without OP.
eanazag - Tuesday, June 10, 2014 - link
When's the Intel giveaway for the P3700?extide - Tuesday, June 10, 2014 - link
LOL! Yeah, SIGN ME UP!! Haha ;)