AMD AM1 Kabini Part 2: Athlon 5350/5150 and Sempron 3850/2650 Tested
by Ian Cutress on May 29, 2014 2:00 PM ESTSYSMark and Scientific Benchmarks
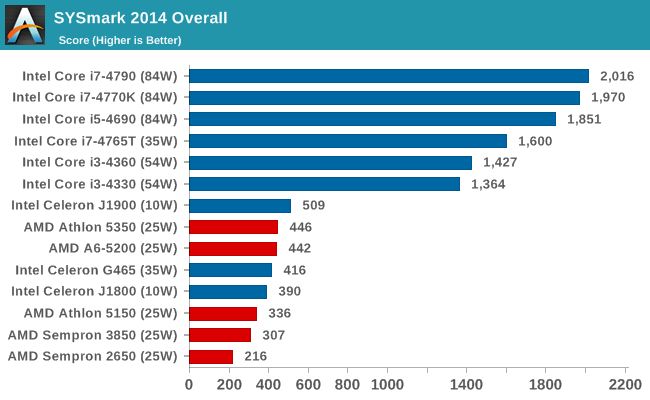
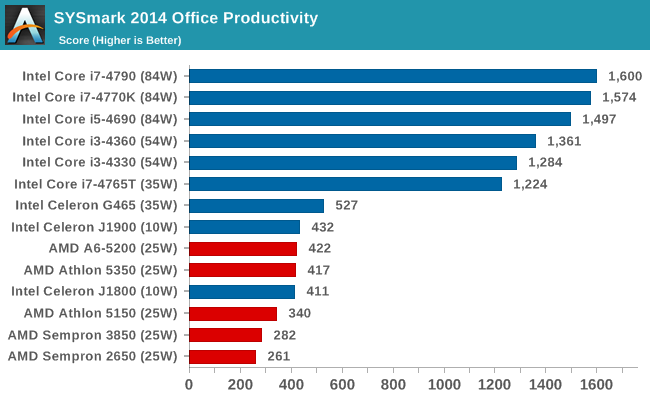
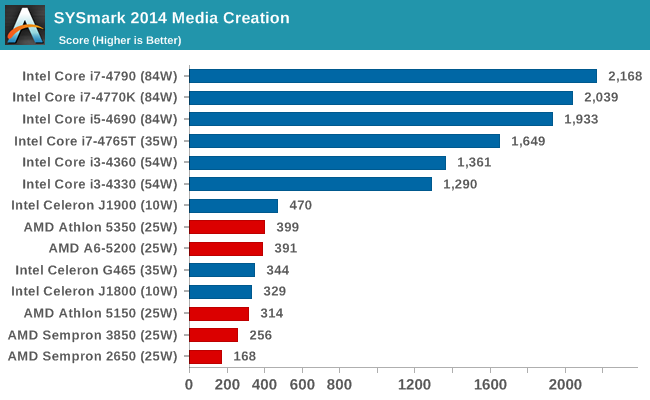
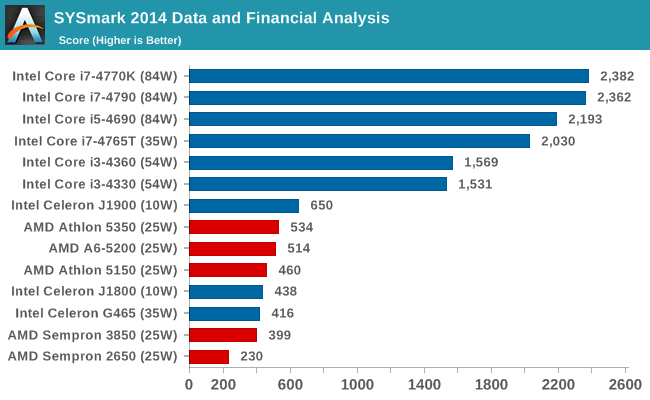
SYSmark 2014
SYSmark is developed by BAPCo, the Business Applications Performance Corporation, which includes in its current members Intel, Dell, Lenovo, Microsoft, Samsung, Sony, and Toshiba. The latest version of SYSmark, SYSmark 2014, uses the latest software packages from Adobe and Microsoft and meshes them together into a stringent testing package that can take a couple of hours to run. The end result gives marks for in office productivity, media creation and data/financial analysis sections as well as an overall result. SYSmark uses a standard office computer (an i3-4130 with a 500GB mechanical drive, 6GB DRAM, 1080p, integrated HD4400 graphics) to provide a benchmark score of ‘1000’, and all results are compared to this. Our testing runs the processors at 1080p with integrated graphics on an OCZ Vertex 3 240GB SF-2281 based SSD.
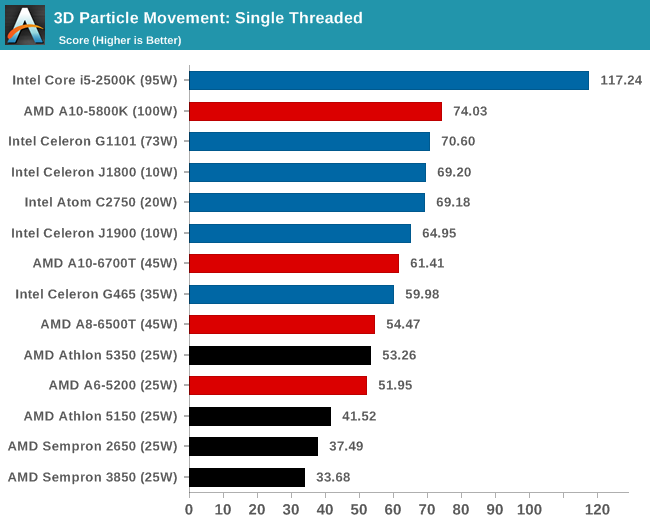
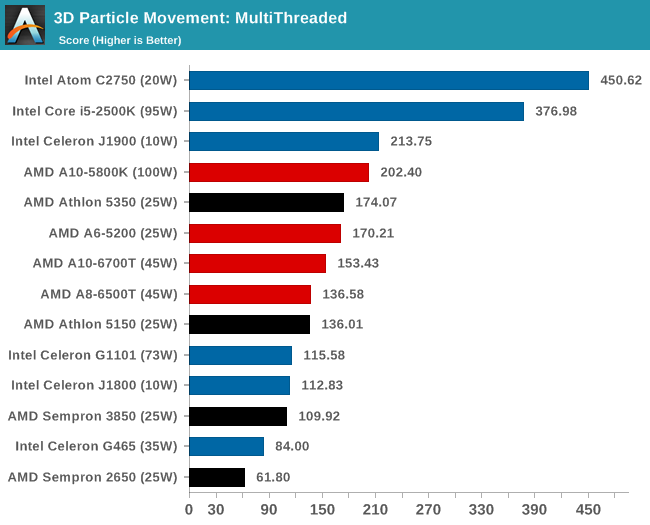
Point Calculations – 3D Movement Algorithm Test: link
3DPM is a self-penned benchmark, taking basic 3D movement algorithms used in Brownian Motion simulations and testing them for speed. High floating point performance, MHz and IPC wins in the single thread version, whereas the multithread version has to handle the threads and loves more cores.
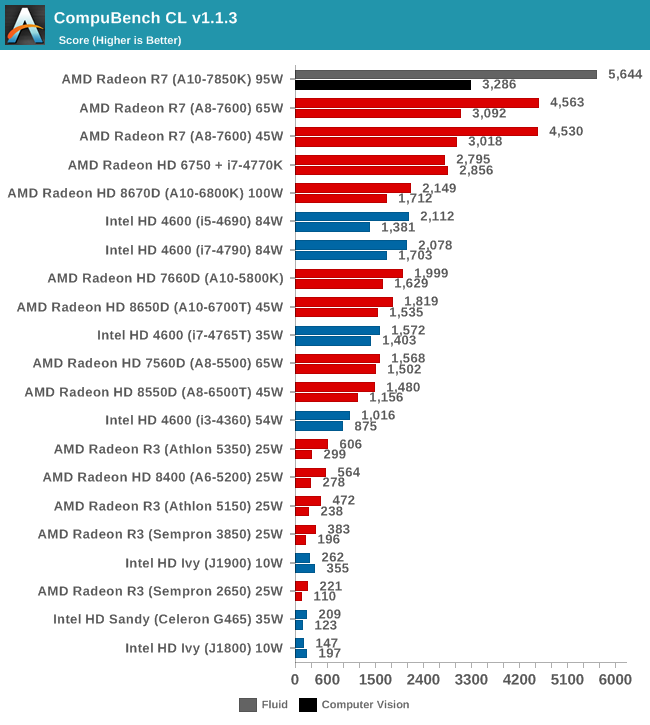
OpenCL – CompuBench: link
CompuBench is an OpenCL and RenderScript benchmark designed by Kishonti for both CPUs and any GPGPU capable device. While it offers almost two dozen tests, we select the more real-world tests in terms of fluid simulation and image analysis benchmarks.


87 Comments
View All Comments
Ian Cutress - Thursday, May 29, 2014 - link
I've adjusted most of the severe cases into graphs that are easier to read :)easp - Thursday, May 29, 2014 - link
Better, but dude, the red bars stand out, and yet they represent something other than the focus of the article. Given the color pallet, I'd assume that the black bars were the least significant numbers, the background information, and yet, they actually represent the focal point of the article.Ian Cutress - Thursday, May 29, 2014 - link
I originally have had blue for Intel and red for AMD. Black is the only other color I can add that doesn't look odd; if graphs start having three-plus colors then it just looks a little odd. It might be worth greying everything and just highlighting the important points without an Intel/AMD distinction except in the labelling for the future.edzieba - Friday, May 30, 2014 - link
How about adding 'cores' to bars that are immediately relevant to the articke (e.g. an orange line in the centre of the bars for the socketed Kabinis and the Celerons). This would highlight the bars that are being compared directly, while still being in the context of all the other data, and keeping the expected blue/Intel red/AMD bar colouring intact.DanNeely - Friday, May 30, 2014 - link
Thanks, that's much better.pjkenned - Thursday, May 29, 2014 - link
Ian - good to see you had similar results as I did. The other bit is that the J1900 can be passively cooled while the AM1 chips need active coolers. That helps lower power consumption, noise and points of failure.I think I had benchmarks with the Raspberry Pi also - these are MUCH faster.
buffhr - Thursday, May 29, 2014 - link
Would have been nice if you could have included some hd video playback (1080p/720p/3D) and impressions.vesoljc - Thursday, May 29, 2014 - link
I second this!nirolf - Friday, May 30, 2014 - link
Me too! Should be fine, but what about 4K?BMNify - Saturday, May 31, 2014 - link
"but what about 4K?"what about it!, it doesn't really exist for consumers, oh perhaps you mean pseudocolor UHD 2160p, or the real colour UHD-1 3840 pixels wide by 2160 tall at 10bit or 12bit per pixel content today as used by several ARM Cortex Soc