AMD Beema/Mullins Architecture & Performance Preview
by Anand Lal Shimpi on April 29, 2014 12:00 AM ESTThe Discovery Tablet
AMD is in a difficult position these days. Traditionally it was the cheaper alternative to Intel, but with Bay Trail Intel made a serious push into segments where OEMs would traditionally use lower cost AMD silicon. In an attempt to be more than a lower cost Intel alternative, AMD is throwing its hat into the form factor reference design race and offering OEMs an example of a full, ideal, high performance implementation of its silicon. One such example is AMD’s Discovery Tablet, an 11.6-inch 1080p Windows 8.1 tablet design that features AMD’s highest end A10 Micro-6700T Mullins silicon. The tablet is a bit larger and heavier than I’d like. If AMD is going to build a reference platform I’d prefer it to be a form factor I’d actually use, which in a tablet is going to be something smaller than 11.6-inches. If you are trying to cover both tablet and 2-in-1 form factors however, the Discovery Tablet makes sense.

I was allowed to spend a few hours benchmarking AMD’s Discovery Tablet. Unfortunately the device wasn’t instrumented for power testing, nor was there enough time to run any battery life tests on it, so the usefulness of these numbers is limited. We already know that AMD’s idle power isn’t as good as smartphone silicon, but for some of these value Windows 8.1 devices it may still be good enough.


Tablet JS/Web Browser Tests
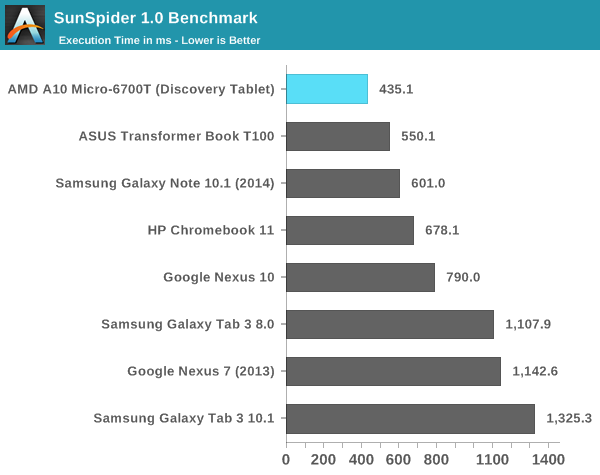
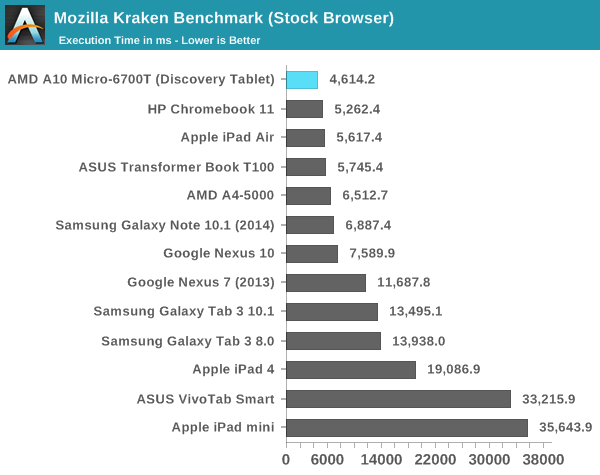
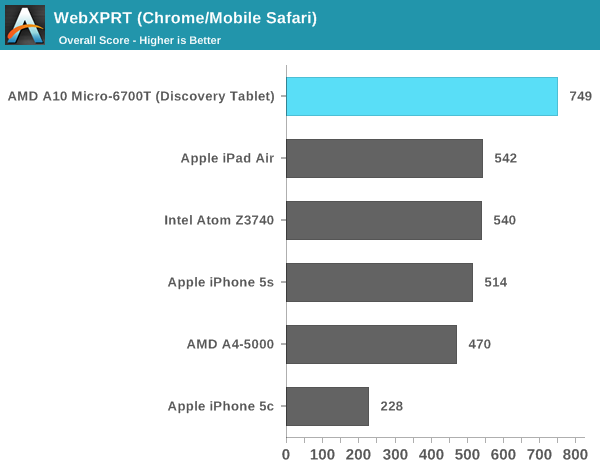
We'll start with our usual set of JavaScript tests. Here we see AMD's A10 Micro-6700T outperform everything on the list. Whether we're talking about Bay Trail or Apple's A7, the 6700T pulls ahead by a decent margin. Once again the big question is how much power is being drawn to deliver this performance. Unlike Intel's Bay Trail preview, AMD didn't have any instrumented Discovery tablets setup for us to monitor power consumption. I suspect AMD's power consumption is competitive, but my guess is it isn't similarly class leading.
CPU Performance
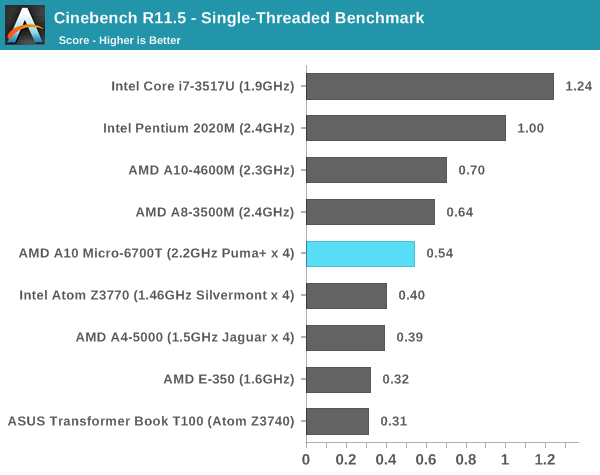
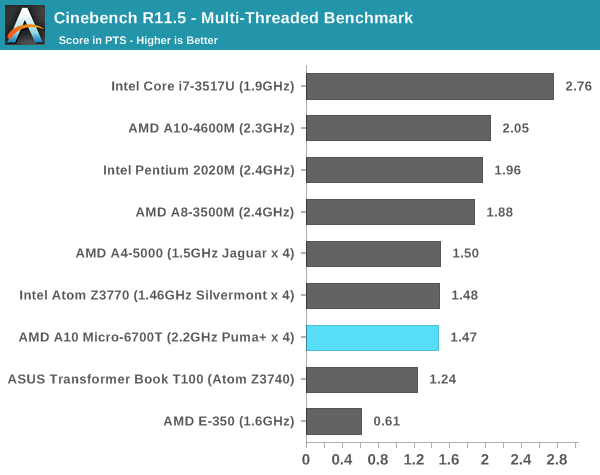
For these next tests I turned to some of our more traditional Windows PC benchmarks. I looked at Cinebench 11.5 to get an idea for how single and multithreaded performance have changed since last year.
Looking at single threaded performance we immediately see the benefits of AMD's new boosting capabilities. The Puma+ cores are 35% faster than Intel's Silvermont cores, and can deliver nearly 80% of the performance of AMD's Piledriver cores found in Trinity. I threw some Llano results in here as well - Mullins offers around 85% of the performance of Llano.
Multithreaded performance is pretty evenly matched between Bay Trail and Mullins here. Note that Mullins manages to deliver very similar performance to Kabini, despite coming in at substantially less power. The comparison to Brazos (E-350) is laughable, Mullins is substantially faster.
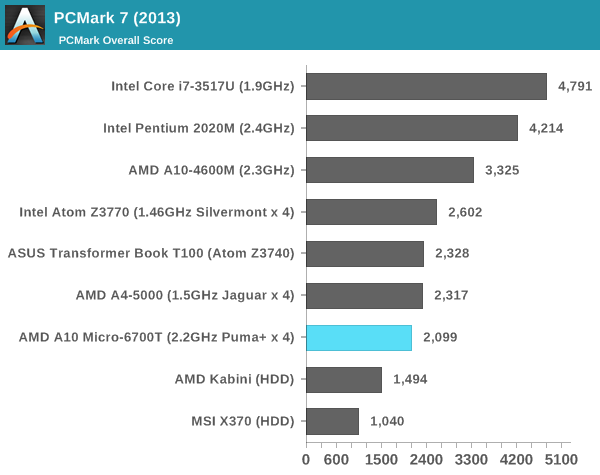
PCMark 7 gives us a better look at the overall performance of the Discovery tablet hardware. Here we do see it lose ground to the Kabini notebook (A4-5000) as well as the Bay Trail devices. It's unclear to me if we are seeing the thermal limits of the hardware (this is a longer test) or if there are other elements at work here (e.g. storage performance limits).
GPU Performance
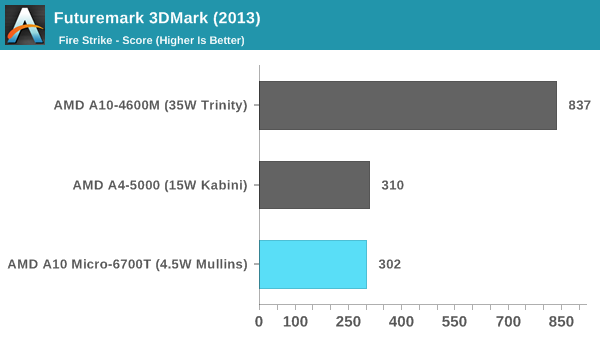
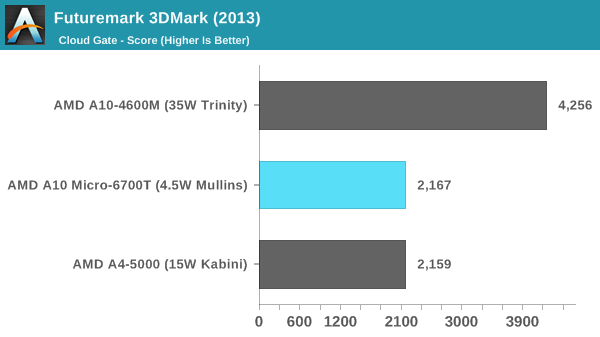
We don’t actually have any Bay Trail devices in our Laptop 2013 bench, they are all in our Tablet 2013 category, which unfortunately uses different benchmarks. To make a long story short, we have Bay Trail vs. Kabini data, and Kabini vs. Mullins data. Thankfully the comparison between Bay Trail and Mullins is pretty easy to make.
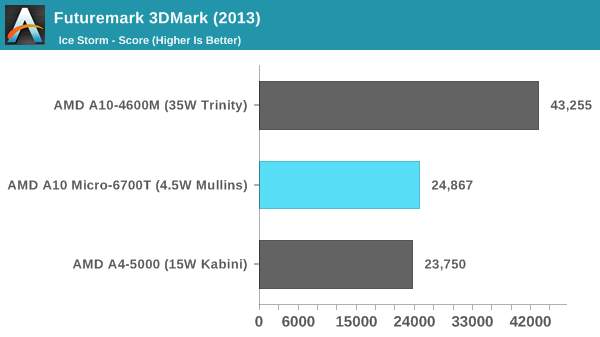
AMD’s 4.5W TDP A10 Micro-6700T delivers roughly the same GPU performance as a 15W A4-5000. The A4-5000 also ends up being anywhere from 50% to over 2x the speed of Bay Trail when it comes to GPU performance, so you can expect Mullins to hold roughly the same advantage.
Compared to the old 35W Trinity, Mullins still has a ways to go. Trinity delivers roughly 2x the performance of Mullins, although at nearly 10x the TDP.


82 Comments
View All Comments
enihcam - Monday, May 19, 2014 - link
AES benchmark is missing.yeeeeman - Sunday, December 31, 2017 - link
Why these AMD products didn't catch on like the Z3XXX line-up from intel did?