The Intel Haswell Refresh Review: Core i7-4790, i5-4690 and i3-4360 Tested
by Ian Cutress on May 11, 2014 3:01 AM ESTSynthetic IGP Benchmarks
OpenCL – CompuBench: link
CompuBench is an OpenCL and RenderScript benchmark designed by Kishonti for both CPUs and any GPGPU capable device. While it offers almost two dozen tests, we select the more real-world tests in terms of fluid simulation and image analysis benchmarks and test on the CPU and IGP respectively. The CPU results are earlier in the review, and the IGP results are below.
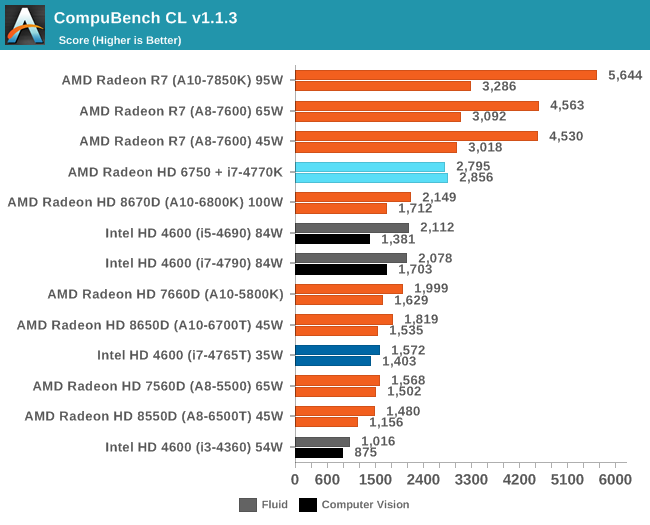
CompuBench responds well to actual cores, but not so much to threads, given by the close scores of the i5 and i7 CPUs. AMD still wins here.
Unity – Graphic Scene 720p: link
As part of my IGP testing I went searching for a couple of new Unity based benchmarks to help decipher the line between the desktop graphics solutions and those that are not so great. First up is a graphical humdinger, implementing a complex scene with lighting effects (including fluid simulation, shadows, SSAO, Bloom). We run the benchmark at 720p with the highest graphical settings, reporting the average FPS.
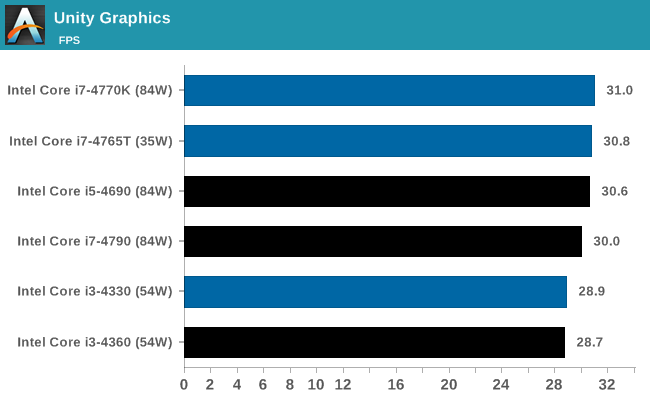
The HD 4600 seems relatively CPU agnostic for complex graphics in Unity. More GPU power seems needed.
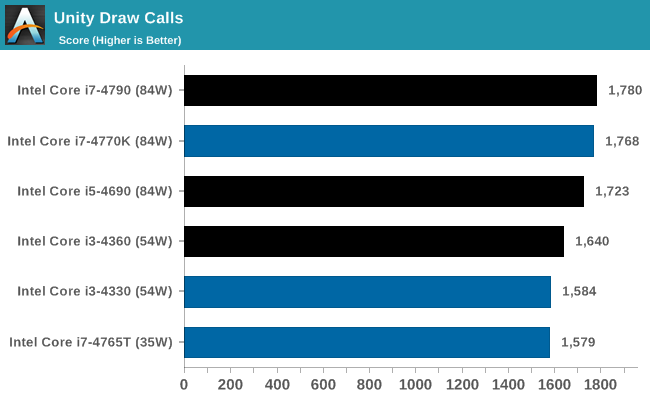
Unity – Draw Calls: link
Next up is a benchmark limited by draw calls rather than rendering complexity. The scene generates simple Nintendo Gamecube polygons that fall due to gravity and bounce around until stationary. The scene continuously spews out these polygons until three consecutive frames fall under a 20 FPS average. We run the benchmark at 720p at simple graphic settings to minimize the graphical complexity, take the number of consoles that spawn from each run and average over several runs.
3DMark
The synthetic tools from Futuremark have been on the benchmarking landscape for over a decade, with each generation designed to tackle new problems as either the CPUs or GPUs become too powerful. Here we test 3DMark 06, 3DMark 11 (Performance) and the latest 3DMark.
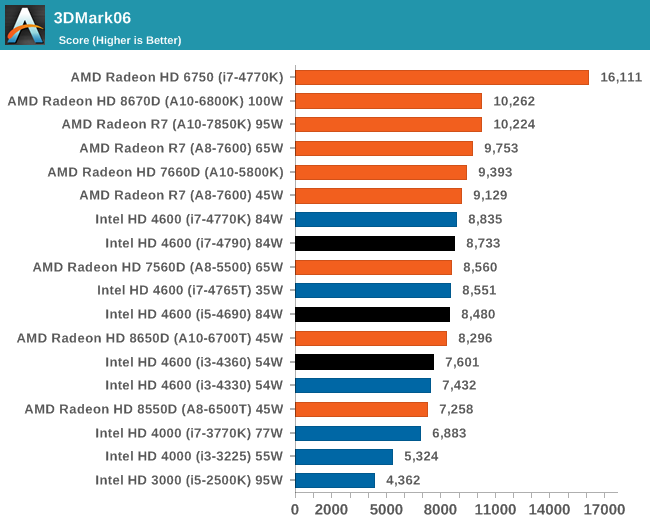
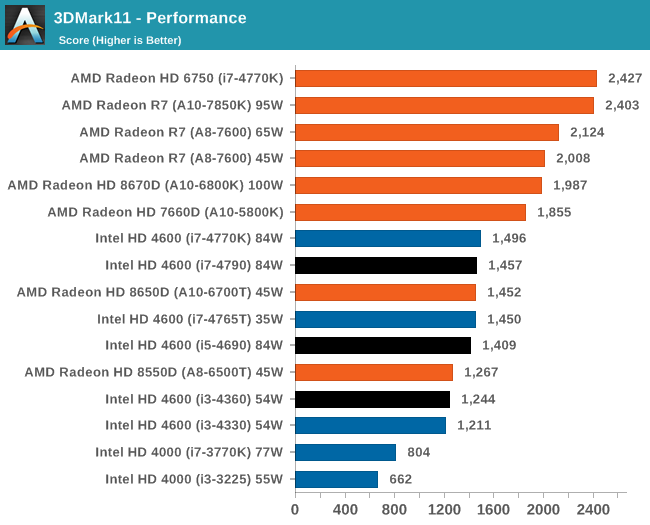
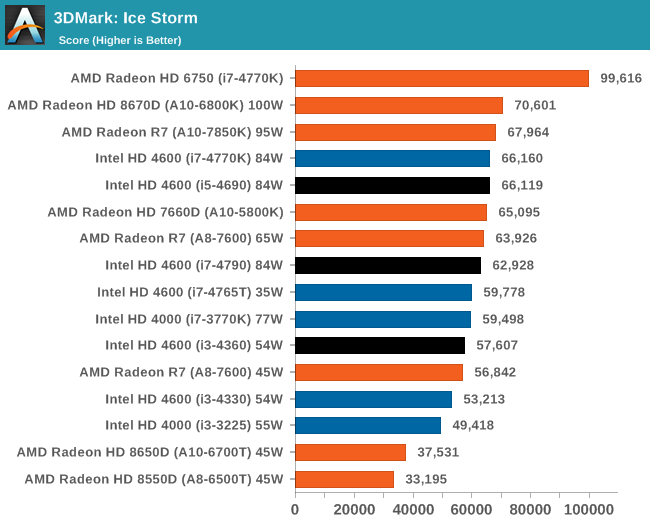
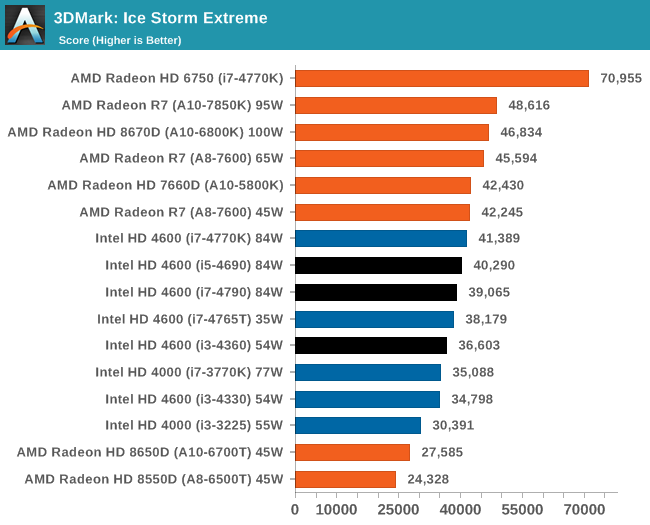
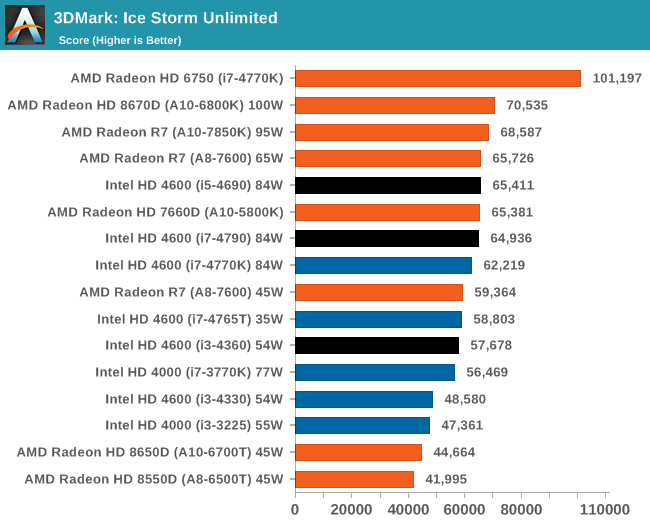
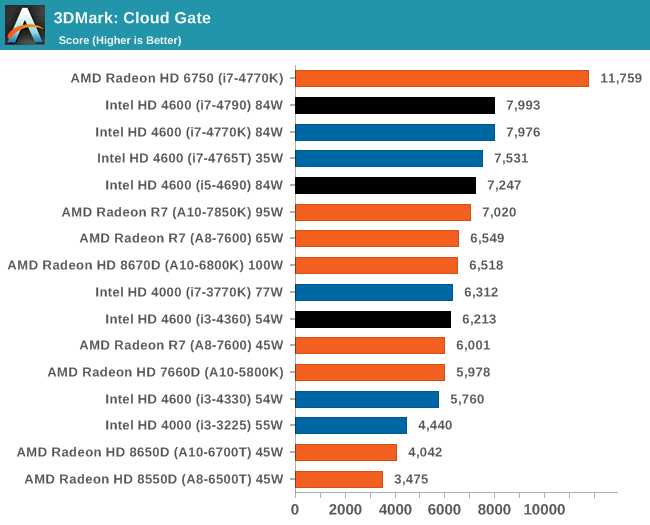
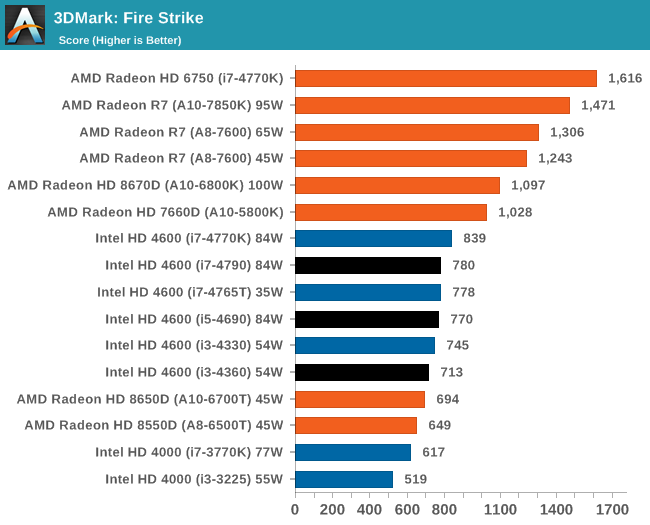
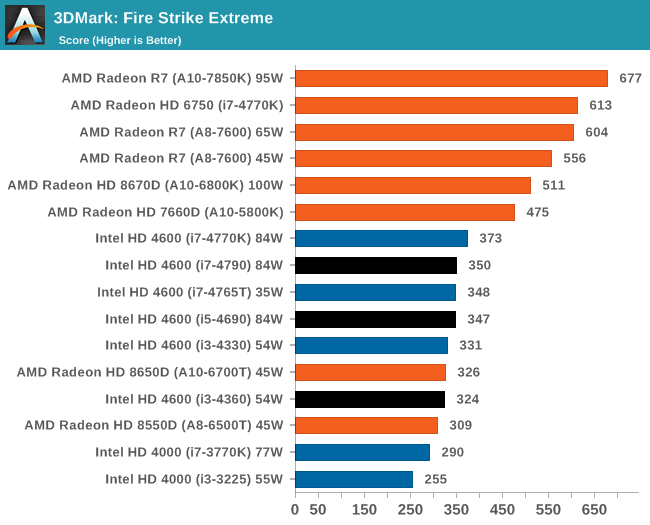
For CPU limited testing, such as Cloud Gate, the Intel i7 pulls ahead with the i5 quickly in tow. For the others, AMD has the lead.
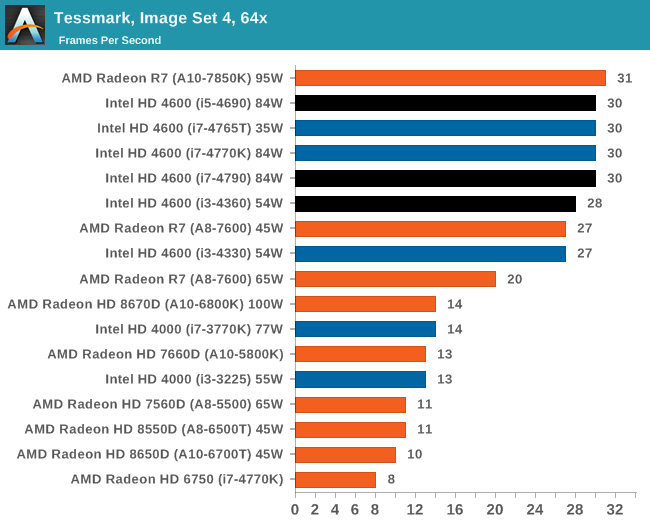
Tessmark
The latest version of TessMark is designed to focus on tessellation via OpenGL 4. We run the latest version of the benchmark using the high resolution map set at maximum tessellation while 1080p full screen, reporting the average FPS.


130 Comments
View All Comments
roxamis - Monday, May 12, 2014 - link
Take the measurement as qualitative not quantitive.Power consumption at the wall doesn't mean much as a number. Its wrong on many levels, only one of which is the PSU efficiency. It doesn't really matter what % is the load, you measure one thing and you try to deduce something else
Wall plug wattmeters can't measure PSUs correclty anyway. Take these numbers with a grain of salt.
MrSpadge - Monday, May 12, 2014 - link
The way it is done now fold the power efficiency curve of the PSU (which is rather steep at low loads) with the actual differences between components (which is what we actually want to measure). Noting that the method in general is not very precise doesn't change this.And since power consumption is not plotted for the multi-GPU setups (and doesn't need to, for such an article) it's not necessary to keep the PSU similar across all configurations. I'd rather have a flat PSU curve for all CPUs - this way I could better judge the differences between them.
rajod1 - Friday, May 30, 2014 - link
Wall power readings do mean something to some people just not you.wpcoe - Sunday, May 11, 2014 - link
The chart comparing the three new Haswell Refresh CPUs with the three previous counterparts shows the i3-4330 as 3500 base frequency, but all the benchmarks following a bit later show the i3-4330 as 3.6Ghz. The ark.intel.com page shows the i3-4330 to be 3.5Ghz, so I think maybe the benchmarks have an incorrect speed?Ian Cutress - Sunday, May 11, 2014 - link
It was just those power test graphs that had it mistyped, my bad. Review updated, 3.5 GHz is the correct frequency.The0ne - Sunday, May 11, 2014 - link
The separation of desktop and workstation hasn't changed. It is technology that has changed and allowed for smaller, faster, quieter, more energy efficient hardware to be use. I felt it was unnecessary to give labels to something such as this. Human-Limiting?bji - Sunday, May 11, 2014 - link
"Human limited" vs "CPU limited" is a much, much clearer way of saying what the author is trying to say than is an artificial definition of "workstation" vs. "desktop" that you are proposing.Flunk - Monday, May 12, 2014 - link
Splitting workstation and desktop has always been about fleecing more money out of people for top end systems. There really isn't a practical difference.Smile286 - Sunday, May 11, 2014 - link
What about temperatures? Are those Haswell Refresh processors less hotter or not?Laststop311 - Sunday, May 11, 2014 - link
Well this was a pointless waste of time. We already know how Haswell performs. Should of just copy pasted the specs and linked back to previous haswell reviews. The only interesting thing, the devil's canyon with better TIM, was the only thing not covered.What people want to see is a bunch of DC OC attempts from various sites to see the average max oc and max temp it has and compare that to the 4770k. Everything else in this refresh is meaningless as we have already seen haswell benchmarked. Grats wasting your time, at least u got paid.