Intel SSD 730 (480GB) Review: Bringing Enterprise to the Consumers
by Kristian Vättö on February 27, 2014 12:00 PM EST- Posted in
- Storage
- SSDs
- Intel
- Intel SSD 730
AnandTech Storage Bench 2011
Back in 2011 (which seems like so long ago now!), we introduced our AnandTech Storage Bench, a suite of benchmarks that took traces of real OS/application usage and played them back in a repeatable manner. The MOASB, officially called AnandTech Storage Bench 2011 - Heavy Workload, mainly focuses on peak IO performance and basic garbage collection routines. There is a lot of downloading and application installing that happens during the course of this test. Our thinking was that it's during application installs, file copies, downloading and multitasking with all of this that you can really notice performance differences between drives.
We tried to cover as many bases as possible with the software incorporated into this test. There's a lot of photo editing in Photoshop, HTML editing in Dreamweaver, web browsing, game playing/level loading (Starcraft II & WoW are both a part of the test) as well as general use stuff (application installing, virus scanning). We've included a large amount of email downloading, document creation and editing as well. To top it all off we even use Visual Studio 2008 to build Chromium during the test.
The test has 2,168,893 read operations and 1,783,447 write operations. The IO breakdown is as follows:
| AnandTech Storage Bench 2011 - Heavy Workload IO Breakdown | ||||
| IO Size | % of Total | |||
| 4KB | 28% | |||
| 16KB | 10% | |||
| 32KB | 10% | |||
| 64KB | 4% | |||
Only 42% of all operations are sequential, the rest range from pseudo to fully random (with most falling in the pseudo-random category). Average queue depth is 4.625 IOs, with 59% of operations taking place in an IO queue of 1. The full description of the test can be found here.
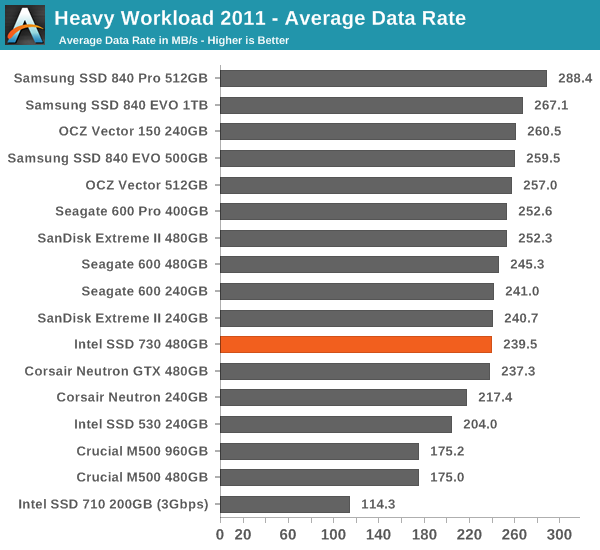
AnandTech Storage Bench 2011 - Heavy Workload
AnandTech Storage Bench 2011 - Light Workload
Our light workload actually has more write operations than read operations. The split is as follows: 372,630 reads and 459,709 writes. The relatively close read/write ratio does better mimic a typical light workload (although even lighter workloads would be far more read centric). There's lots of web browsing, photo editing (but with a greater focus on photo consumption), video playback as well as some application installs and gaming.
The I/O breakdown is similar to the heavy workload at small IOs, however you'll notice that there are far fewer large IO transfers.
| AnandTech Storage Bench 2011 - Light Workload IO Breakdown | ||||
| IO Size | % of Total | |||
| 4KB | 27% | |||
| 16KB | 8% | |||
| 32KB | 6% | |||
| 64KB | 5% | |||
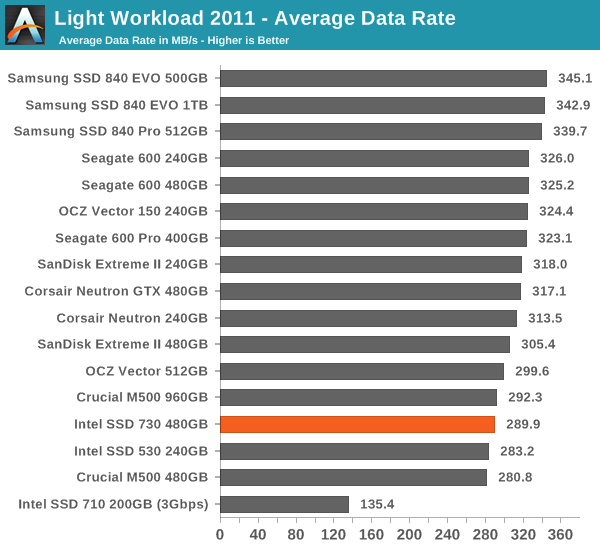
Again, the SSD 730 comes up with relatively uninspiring performance in this lighter, older workload. If your usage patterns are relatively tame, a drive designed for enterprise usage scenarios may be more than you need and may actually end up performing slower than "lesser" drives in day-to-day use—not that you'd likely notice, as most decent SSDs are now at the point where to normal users they're all plenty fast.


96 Comments
View All Comments
Namey - Friday, February 28, 2014 - link
AgreededDeath666Angel - Friday, February 28, 2014 - link
Hm, so the Oxford Dictionary recognized word "monies" sounds uneducated to you? And it seems that documentated and adaptated are perfectly fine and acceptable words as well. Just because you don't use them in every day language or they sound weird does not mean they are not correct. There are many different types of spoken and written English language. And making fun of one of the (correct) ways to write that language does seem, what's the word, uneducated. :PMipmap - Thursday, February 27, 2014 - link
"build a drive significantly that was better than the other offerings."build a drive that was significantly better than the other offerings.
JarredWalton - Thursday, February 27, 2014 - link
Man, I seriously flubbed that sentence/paragraph on the editing pass. I think I tried to copy/paste to rearrange words but somehow missed. LOLGuspaz - Thursday, February 27, 2014 - link
The endurance figures must be wrong. They're quoting that the drive supports only 267 cycles before it dies (128TB / 480GB = ~267), which is absurdly low. This is supposed to be high endurance MLC, but even Samsung's TLC has multiple times higher endurance than that...KAlmquist - Thursday, February 27, 2014 - link
Perhaps Intel is assuming 3000 cycles and a worst case write amplification of 12. (If you aren't familiar with write amplification, see Anand's early SSD articles on this site.)Guspaz - Thursday, February 27, 2014 - link
Intel previously claimed a write amplification of 1.1 way back in the G1 days. Are you saying that this drive has an order of magnitude worse write amplification than their oldest drives?futrtrubl - Friday, February 28, 2014 - link
Remember that they are using enterprise metrics and not client metrics on this. It could be the you can be more flexible on the WA you can assume on client drives.Guspaz - Friday, February 28, 2014 - link
Perhaps, but don't you think that the order of magnitude reduction in claimed write endurance deserves a call out in the article, if only to explain why that's the case?KAlmquist - Friday, February 28, 2014 - link
The 1.1 write amplification was presumably typical rather than worst case. I wouldn't expect the write amplification to be that much different from the G1. The large block and page sizes probably make write amplification a bit worse, but the algorithms may have improved a bit.I agree with your comment below that it would have been nice if the reviewer had queried Intel about the endurance spec, rather than leaving us to speculate.