OCZ Vertex 460 (240GB) Review
by Kristian Vättö on January 22, 2014 9:00 AM EST- Posted in
- Storage
- SSDs
- OCZ
- Indilinx
- Vertex 460
Performance Consistency
In our Intel SSD DC S3700 review Anand introduced a new method of characterizing performance: looking at the latency of individual operations over time. The S3700 promised a level of performance consistency that was unmatched in the industry, and as a result needed some additional testing to show that. The reason we don't have consistent IO latency with SSDs is because inevitably all controllers have to do some amount of defragmentation or garbage collection in order to continue operating at high speeds. When and how an SSD decides to run its defrag and cleanup routines directly impacts the user experience. Frequent (borderline aggressive) cleanup generally results in more stable performance, while delaying that can result in higher peak performance at the expense of much lower worst-case performance. The graphs below tell us a lot about the architecture of these SSDs and how they handle internal defragmentation.
To generate the data below we take a freshly secure erased SSD and fill it with sequential data. This ensures that all user accessible LBAs have data associated with them. Next we kick off a 4KB random write workload across all LBAs at a queue depth of 32 using incompressible data. We run the test for just over half an hour, nowhere near what we run our steady state tests for but enough to give a good look at drive behavior once all spare area fills up.
We record instantaneous IOPS every second for the duration of the test and then plot IOPS vs. time and generate the scatter plots below. Each set of graphs features the same scale. The first two sets use a log scale for easy comparison, while the last set of graphs uses a linear scale that tops out at 40K IOPS for better visualization of differences between drives.
The high level testing methodology remains unchanged from our S3700 review. Unlike in previous reviews however, we vary the percentage of the drive that gets filled/tested depending on the amount of spare area we're trying to simulate. The buttons are labeled with the advertised user capacity had the SSD vendor decided to use that specific amount of spare area. If you want to replicate this on your own all you need to do is create a partition smaller than the total capacity of the drive and leave the remaining space unused to simulate a larger amount of spare area. The partitioning step isn't absolutely necessary in every case but it's an easy way to make sure you never exceed your allocated spare area. It's a good idea to do this from the start (e.g. secure erase, partition, then install Windows), but if you are working backwards you can always create the spare area partition, format it to TRIM it, then delete the partition. Finally, this method of creating spare area works on the drives we've tested here but not all controllers are guaranteed to behave the same way.
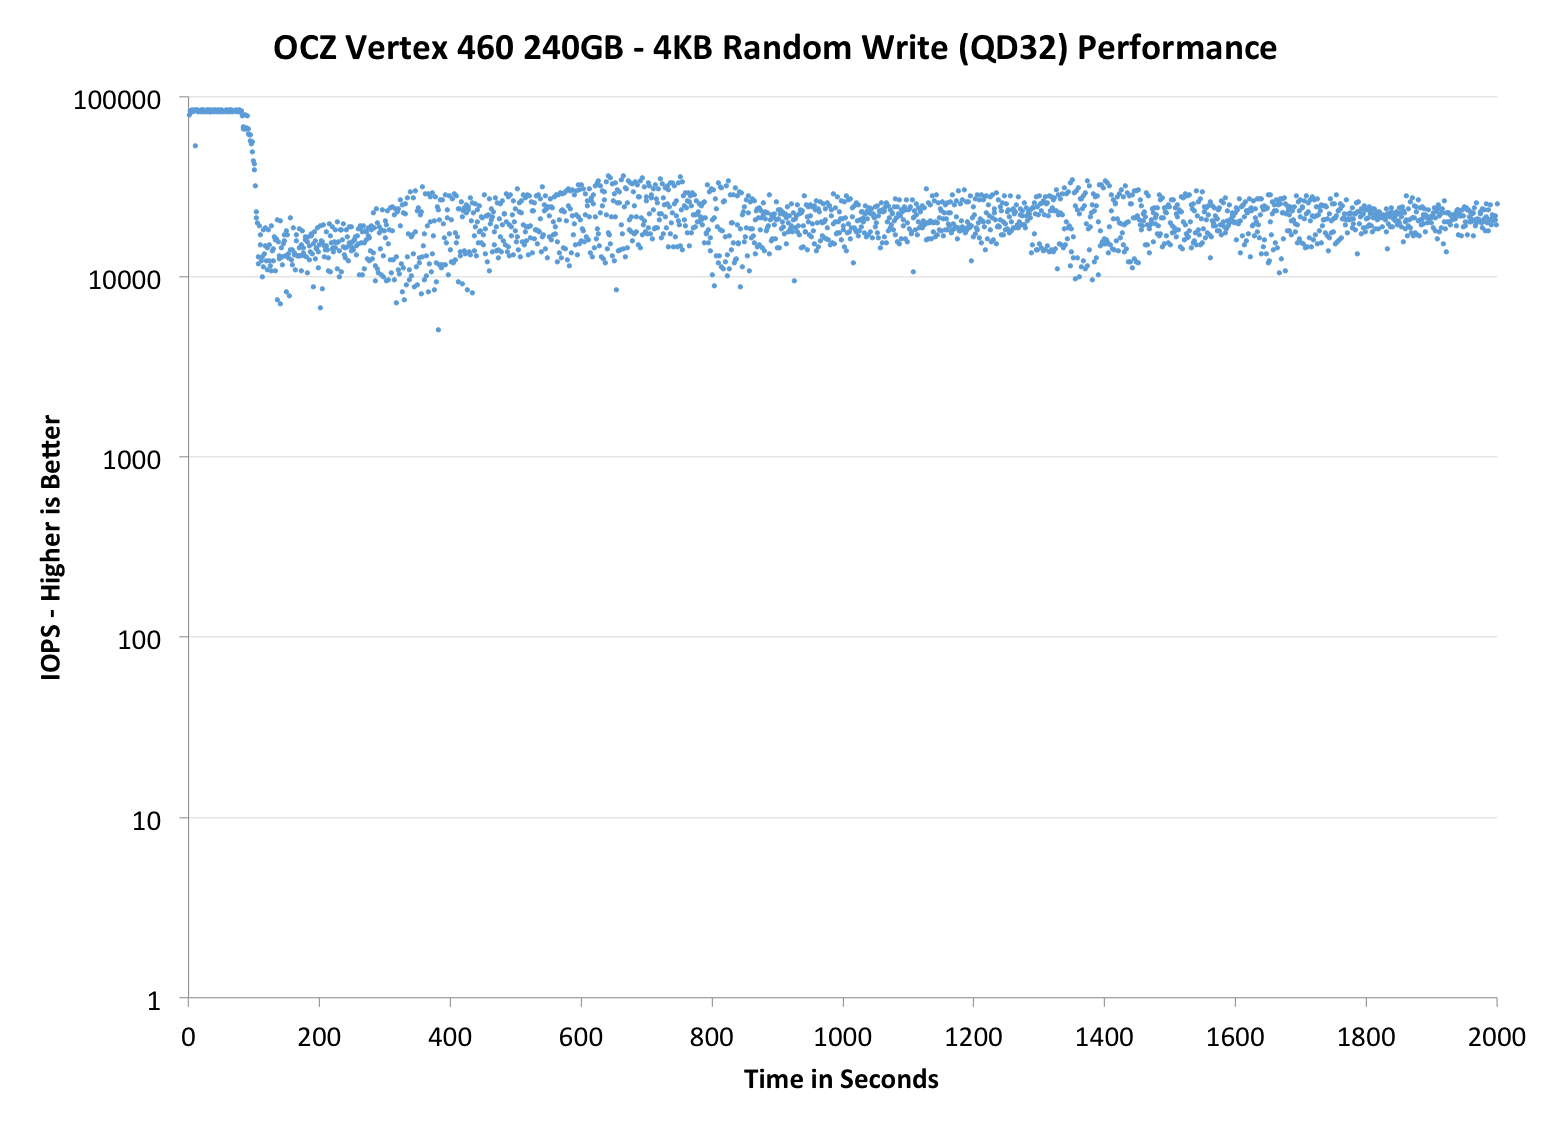
The first set of graphs shows the performance data over the entire 2000 second test period. In these charts you'll notice an early period of very high performance followed by a sharp dropoff. What you're seeing in that case is the drive allocating new blocks from its spare area, then eventually using up all free blocks and having to perform a read-modify-write for all subsequent writes (write amplification goes up, performance goes down).
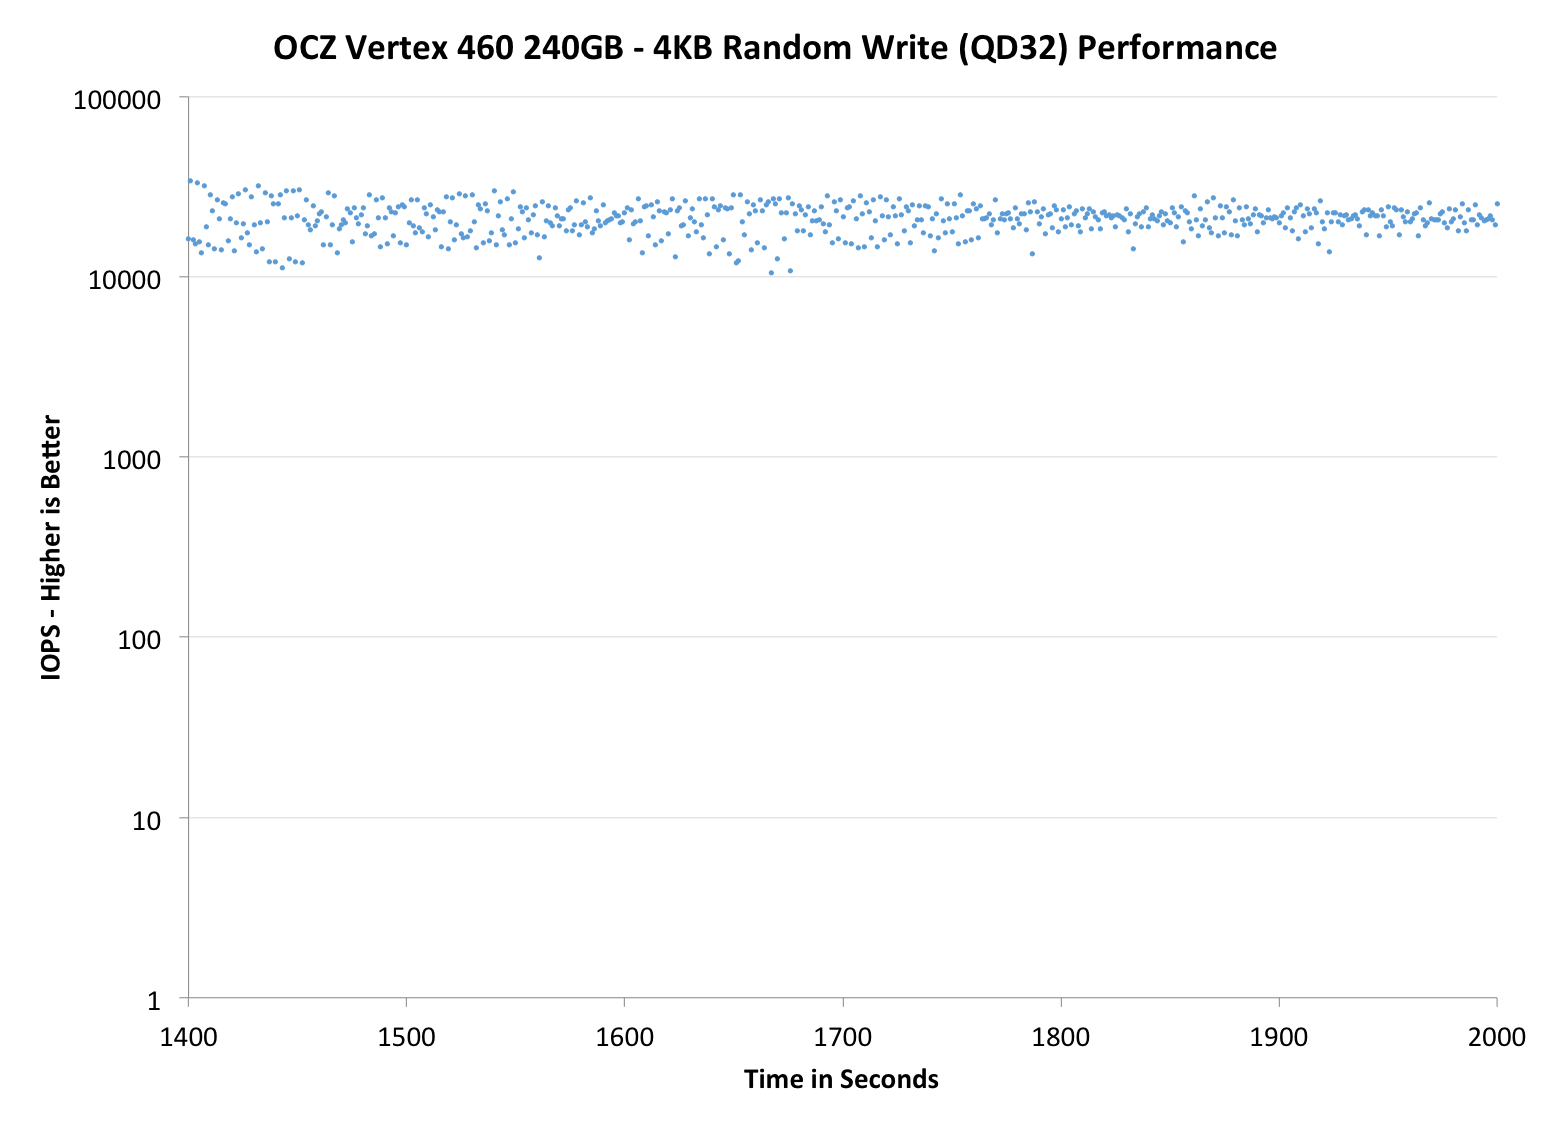
The second set of graphs zooms in to the beginning of steady state operation for the drive (t=1400s). The third set also looks at the beginning of steady state operation but on a linear performance scale. Click the buttons below each graph to switch source data.
 |
|||||||||
| OCZ Vertex 460 240GB | OCZ Vector 150 240GB | Corsair Neutron 240GB | Sandisk Extreme II 480GB | Samsung SSD 840 Pro 256GB | |||||
| Default | |||||||||
| 25% OP | |||||||||
Performance consistency is more or less a match with the Vector 150. There is essentially no difference, only some slight variation which may as well be caused by the nature of how garbage collection algorithms work (i.e. the result is never exactly the same).
 |
|||||||||
| OCZ Vertex 460 240GB | OCZ Vector 150 240GB | Corsair Neutron 240GB | SanDisk Extreme II 480GB | Samsung SSD 840 Pro 256GB | |||||
| Default | |||||||||
| 25% OP | |||||||||
 |
|||||||||
| OCZ Vertex 460 240GB | OCZ Vector 150 240GB | Corsair Neutron 240GB | SanDisk Extreme II 480GB | Samsung SSD 840 Pro 256GB | |||||
| Default | |||||||||
| 25% OP | |||||||||
TRIM Validation
To test TRIM, I first filled all user-accessible LBAs with sequential data and continued with torturing the drive with 4KB random writes (100% LBA, QD=32) for 60 minutes. After the torture I TRIM'ed the drive (quick format in Windows 7/8) and ran HD Tach to make sure TRIM is functional.
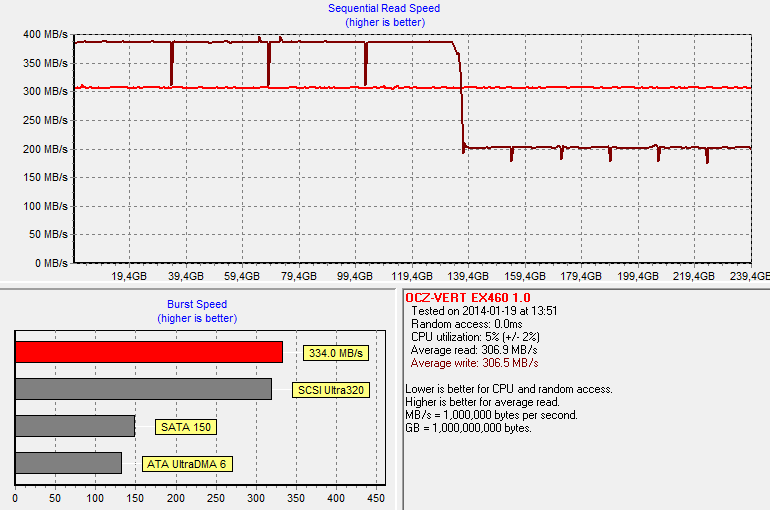
And TRIM works. The HD Tach graph also shows the impact of OCZ's performance mode, although in a negative light. Once half of the LBAs have been filled, all data has to be reorganized. The result is a decrease in write performance as the drive is reorganizing the existing data at the same time as HD Tach is writing to it. Once the reorganization process is over, the performance will recover close to the original performance.


69 Comments
View All Comments
Hrel - Wednesday, January 22, 2014 - link
Seems to me Mushkin is the SSD to get right now. Only one rated at 2Million MTBF that I've seen as well as having very high sequential and random IOPS.dcollins - Wednesday, January 22, 2014 - link
Sorry, I don't take chances with storage. Samsung SSDs can't be beaten right now, and have proven rock solid over the last year. My family has 5 in total and most of my teammates at work have 500GB drives. Zero problems, great performance. Going with OCZ just seems needlessly risky.blanarahul - Wednesday, January 22, 2014 - link
And that sums up the review. Samsung is like the Goku of SSDs. Try hard as you might. You can't beat them in long term.LB-ID - Wednesday, January 22, 2014 - link
They have new corporate overlords, but it's still the same OCZ. That's really all I needed to know. I simply cannot trust the people at OCZ for any of the things I care about in a product: reliability, accountability, and service.ezridah - Wednesday, January 22, 2014 - link
The Newegg prices are different for the 2 lower capacity drives today. They are now $120 for the 120GB and $140 for the 240GB. Not a bad price for the 240GB drive. An extra $20 for double the storage is a no-brainer.Bob Todd - Wednesday, January 22, 2014 - link
They've also got the 240GB Crucial M500 for $130 right now...BlakKW - Thursday, January 23, 2014 - link
"By doing additional validation, OCZ is able to pick the highest endurance parts and use them..."I don't understand this and it makes me curious: how can NAND be tested for endurance, and then used in an SSD? It seems to me that any extensive testing would use up a significant portion of the NAND's finite lifespan?
And if testing the identical parts, how does a test differentiate good vs bad when it comes to endurance?
TY
lmcd - Friday, January 24, 2014 - link
I'm sure the endurance testing doesn't come from simply wearing it out and testing. There may be some extrapolation methods or some different tools altogether.LordConrad - Thursday, January 23, 2014 - link
I have never had any issues with OCZ SSDs. I think this Vertex 460 looks like a decent drive, although I would go for the Vector due to the longer warranty.chris81 - Thursday, January 23, 2014 - link
Typo: 4KB Random Read is written twice in the first table. The second one should be Random Write