Samsung SSD 840 EVO mSATA (120GB, 250GB, 500GB & 1TB) Review
by Kristian Vättö on January 9, 2014 1:35 PM ESTAnandTech Storage Bench 2013
When Anand built the AnandTech Heavy and Light Storage Bench suites in 2011 he did so because we did not have any good tools at the time that would begin to stress a drive's garbage collection routines. Once all blocks have a sufficient number of used pages, all further writes will inevitably trigger some sort of garbage collection/block recycling algorithm. Our Heavy 2011 test in particular was designed to do just this. By hitting the test SSD with a large enough and write intensive enough workload, we could ensure that some amount of GC would happen.
There were a couple of issues with our 2011 tests that we've been wanting to rectify however. First off, all of our 2011 tests were built using Windows 7 x64 pre-SP1, which meant there were potentially some 4K alignment issues that wouldn't exist had we built the trace on a system with SP1. This didn't really impact most SSDs but it proved to be a problem with some hard drives. Secondly, and more recently, we've shifted focus from simply triggering GC routines to really looking at worst-case scenario performance after prolonged random IO.
For years we'd felt the negative impacts of inconsistent IO performance with all SSDs, but until the S3700 showed up we didn't think to actually measure and visualize IO consistency. The problem with our IO consistency tests is that they are very focused on 4KB random writes at high queue depths and full LBA spans–not exactly a real world client usage model. The aspects of SSD architecture that those tests stress however are very important, and none of our existing tests were doing a good job of quantifying that.
We needed an updated heavy test, one that dealt with an even larger set of data and one that somehow incorporated IO consistency into its metrics. We think we have that test. The new benchmark doesn't even have a name, we've just been calling it The Destroyer (although AnandTech Storage Bench 2013 is likely a better fit for PR reasons).
Everything about this new test is bigger and better. The test platform moves to Windows 8 Pro x64. The workload is far more realistic. Just as before, this is an application trace based test–we record all IO requests made to a test system, then play them back on the drive we're measuring and run statistical analysis on the drive's responses.
Imitating most modern benchmarks Anand crafted the Destroyer out of a series of scenarios. For this benchmark we focused heavily on Photo editing, Gaming, Virtualization, General Productivity, Video Playback and Application Development. Rough descriptions of the various scenarios are in the table below:
| AnandTech Storage Bench 2013 Preview - The Destroyer | ||||||||||||
| Workload | Description | Applications Used | ||||||||||
| Photo Sync/Editing | Import images, edit, export | Adobe Photoshop CS6, Adobe Lightroom 4, Dropbox | ||||||||||
| Gaming | Download/install games, play games | Steam, Deus Ex, Skyrim, Starcraft 2, BioShock Infinite | ||||||||||
| Virtualization | Run/manage VM, use general apps inside VM | VirtualBox | ||||||||||
| General Productivity | Browse the web, manage local email, copy files, encrypt/decrypt files, backup system, download content, virus/malware scan | Chrome, IE10, Outlook, Windows 8, AxCrypt, uTorrent, AdAware | ||||||||||
| Video Playback | Copy and watch movies | Windows 8 | ||||||||||
| Application Development | Compile projects, check out code, download code samples | Visual Studio 2012 | ||||||||||
While some tasks remained independent, many were stitched together (e.g. system backups would take place while other scenarios were taking place). The overall stats give some justification to what we've been calling this test internally:
| AnandTech Storage Bench 2013 Preview - The Destroyer, Specs | |||||||||||||
| The Destroyer (2013) | Heavy 2011 | ||||||||||||
| Reads | 38.83 million | 2.17 million | |||||||||||
| Writes | 10.98 million | 1.78 million | |||||||||||
| Total IO Operations | 49.8 million | 3.99 million | |||||||||||
| Total GB Read | 1583.02 GB | 48.63 GB | |||||||||||
| Total GB Written | 875.62 GB | 106.32 GB | |||||||||||
| Average Queue Depth | ~5.5 | ~4.6 | |||||||||||
| Focus | Worst-case multitasking, IO consistency | Peak IO, basic GC routines | |||||||||||
SSDs have grown in their performance abilities over the years, so we wanted a new test that could really push high queue depths at times. The average queue depth is still realistic for a client workload, but the Destroyer has some very demanding peaks. When we first introduced the Heavy 2011 test, some drives would take multiple hours to complete it; today most high performance SSDs can finish the test in under 90 minutes. The Destroyer? So far the fastest we've seen it go is 10 hours. Most high performance SSDs we've tested seem to need around 12–13 hours per run, with mainstream drives taking closer to 24 hours. The read/write balance is also a lot more realistic than in the Heavy 2011 test. Back in 2011 we just needed something that had a ton of writes so we could start separating the good from the bad. Now that the drives have matured, we felt a test that was a bit more balanced would be a better idea.
Despite the balance recalibration, there is just a ton of data moving around in this test. Ultimately the sheer volume of data here and the fact that there's a good amount of random IO courtesy of all of the multitasking (e.g. background VM work, background photo exports/syncs, etc...) makes the Destroyer do a far better job of giving credit for performance consistency than the old Heavy 2011 test. Both tests are valid; they just stress/showcase different things. As the days of begging for better random IO performance and basic GC intelligence are over, we wanted a test that would give us a bit more of what we're interested in these days. As Anand mentioned in the S3700 review, having good worst-case IO performance and consistency matters just as much to client users as it does to enterprise users.
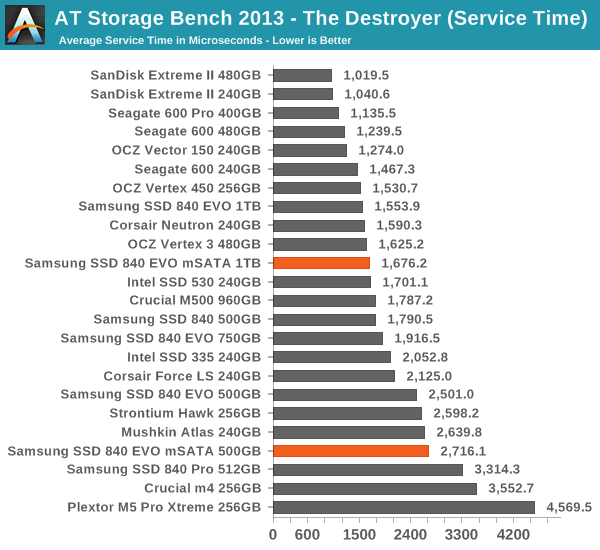
We are reporting two primary metrics with the Destroyer: average data rate in MB/s and average service time in microseconds. The former gives you an idea of the throughput of the drive during the time that it was running the Destroyer workload. This can be a very good indication of overall performance. What average data rate doesn't do a good job of is taking into account response time of very bursty (read: high queue depth) IO. By reporting average service time we heavily weigh latency for queued IOs. You'll note that this is a metric we've been reporting in our enterprise benchmarks for a while now. With the client tests maturing, the time was right for a little convergence.
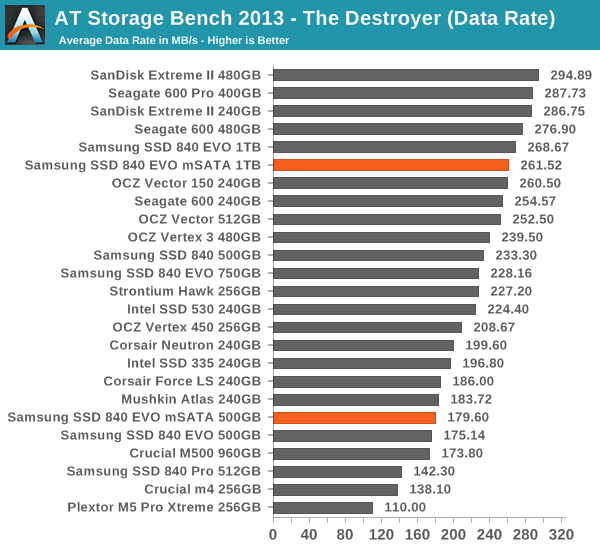
Update: It appears that something was off in the first run as the 1TB scored 261.52MB/s when I retested it.
I'm not sure if I'm comfortable with the score above. There are no other benchmarks that would indicate the EVO mSATA to be over 20% faster than the 2.5" EVO, so I'm thinking there has been some kind of an error in the test. Unfortunately I didn't have time to rerun the test because The Destroyer takes roughly 12 hours to run and another eight or so hours to be analyzed. However, I managed to run it on the 500GB EVO mSATA and as the graph above shows, its performance is on-par with the 2.5" EVO. I'll rerun the test on the 1TB sample once I get back and will update this based on its output.


65 Comments
View All Comments
spejr - Tuesday, January 14, 2014 - link
Why do people still use mSATA? It might not make a difference for IOPS, but when opening a program the higher sequential read of PCIe would be a benefit. The NAND could supposedly go faster than 540.Kristian Vättö - Wednesday, January 15, 2014 - link
Because the support for PCIe is very limited. There are only a handful of laptops that use PCIe SSDs (and some of the have a proprietary connector like the MacBook Air) and in the desktop world all PCIe SSDs are currently just two or more SATA SSDs in RAID (though that will change during the next few months).bbordwell - Wednesday, January 15, 2014 - link
Any chance we could get an in depth review of Samsung's RAPID now that it is available on both the EVO and the PRO? I am curious if it would have a larger impact for writes on the PRO than the EVO since the PRO does not have the SLC write cache.RShack - Friday, January 17, 2014 - link
What % of your responses are to posters who evidently haven't bothered to even read the dang article?swiftdimension - Friday, January 17, 2014 - link
Just curious, if you guys connect a mSATA drive by letting it dangle connected to power and a SATA cable since the Asrock z68 Pro 3 doesnt have a mSata slot?Kristian Vättö - Saturday, January 18, 2014 - link
We use an mSATA to SATA 6Gbps adapter.Qlaras - Friday, January 17, 2014 - link
So I was considering ordering one of Gigabyte's sole AMD Brix - GB-BXA8-5545, and a 180-240GB mSATA SSD. (Now that the Brix is FINALLY released)Torn between waiting for the Samsung 840 EVO mSATA and just paying the premium for an Intel 525 and getting it now.
The Samsung has newer features/tech, and the price will (probably) be lower - MSRP matches what the 525 is going for now though, and the 525 comes with a 5-year warranty, versus 3 on the EVOs.
Thoughts?
Kristian Vättö - Saturday, January 18, 2014 - link
Crucial M500 should be a good compromise -- it's available now and the pricing is competitive.Coup27 - Saturday, January 18, 2014 - link
Did that maximum bus speed vs latency graph really come from Micron? It's clearly been drawn in MS Paint. The Y axis isn't even vertical!Good article nevertheless.
Kristian Vättö - Sunday, January 19, 2014 - link
Yup, here's the presentation (slide 9): http://www.flashmemorysummit.com/English/Collatera...