Samsung SSD 840 EVO mSATA (120GB, 250GB, 500GB & 1TB) Review
by Kristian Vättö on January 9, 2014 1:35 PM ESTPerformance Consistency
In our Intel SSD DC S3700 review Anand introduced a new method of characterizing performance: looking at the latency of individual operations over time. The S3700 promised a level of performance consistency that was unmatched in the industry, and as a result needed some additional testing to show that. The reason we don't have consistent IO latency with SSDs is because inevitably all controllers have to do some amount of defragmentation or garbage collection in order to continue operating at high speeds. When and how an SSD decides to run its defrag and cleanup routines directly impacts the user experience. Frequent (borderline aggressive) cleanup generally results in more stable performance, while delaying that can result in higher peak performance at the expense of much lower worst-case performance. The graphs below tell us a lot about the architecture of these SSDs and how they handle internal defragmentation.
To generate the data below we take a freshly secure erased SSD and fill it with sequential data. This ensures that all user accessible LBAs have data associated with them. Next we kick off a 4KB random write workload across all LBAs at a queue depth of 32 using incompressible data. We run the test for just over half an hour, nowhere near what we run our steady state tests for but enough to give a good look at drive behavior once all spare area fills up.
We record instantaneous IOPS every second for the duration of the test and then plot IOPS vs. time and generate the scatter plots below. Each set of graphs features the same scale. The first two sets use a log scale for easy comparison, while the last set of graphs uses a linear scale that tops out at 40K IOPS for better visualization of differences between drives.
The high level testing methodology remains unchanged from our S3700 review. Unlike in previous reviews however, we vary the percentage of the drive that gets filled/tested depending on the amount of spare area we're trying to simulate. The buttons are labeled with the advertised user capacity had the SSD vendor decided to use that specific amount of spare area. If you want to replicate this on your own all you need to do is create a partition smaller than the total capacity of the drive and leave the remaining space unused to simulate a larger amount of spare area. The partitioning step isn't absolutely necessary in every case but it's an easy way to make sure you never exceed your allocated spare area. It's a good idea to do this from the start (e.g. secure erase, partition, then install Windows), but if you are working backwards you can always create the spare area partition, format it to TRIM it, then delete the partition. Finally, this method of creating spare area works on the drives we've tested here but not all controllers are guaranteed to behave the same way.
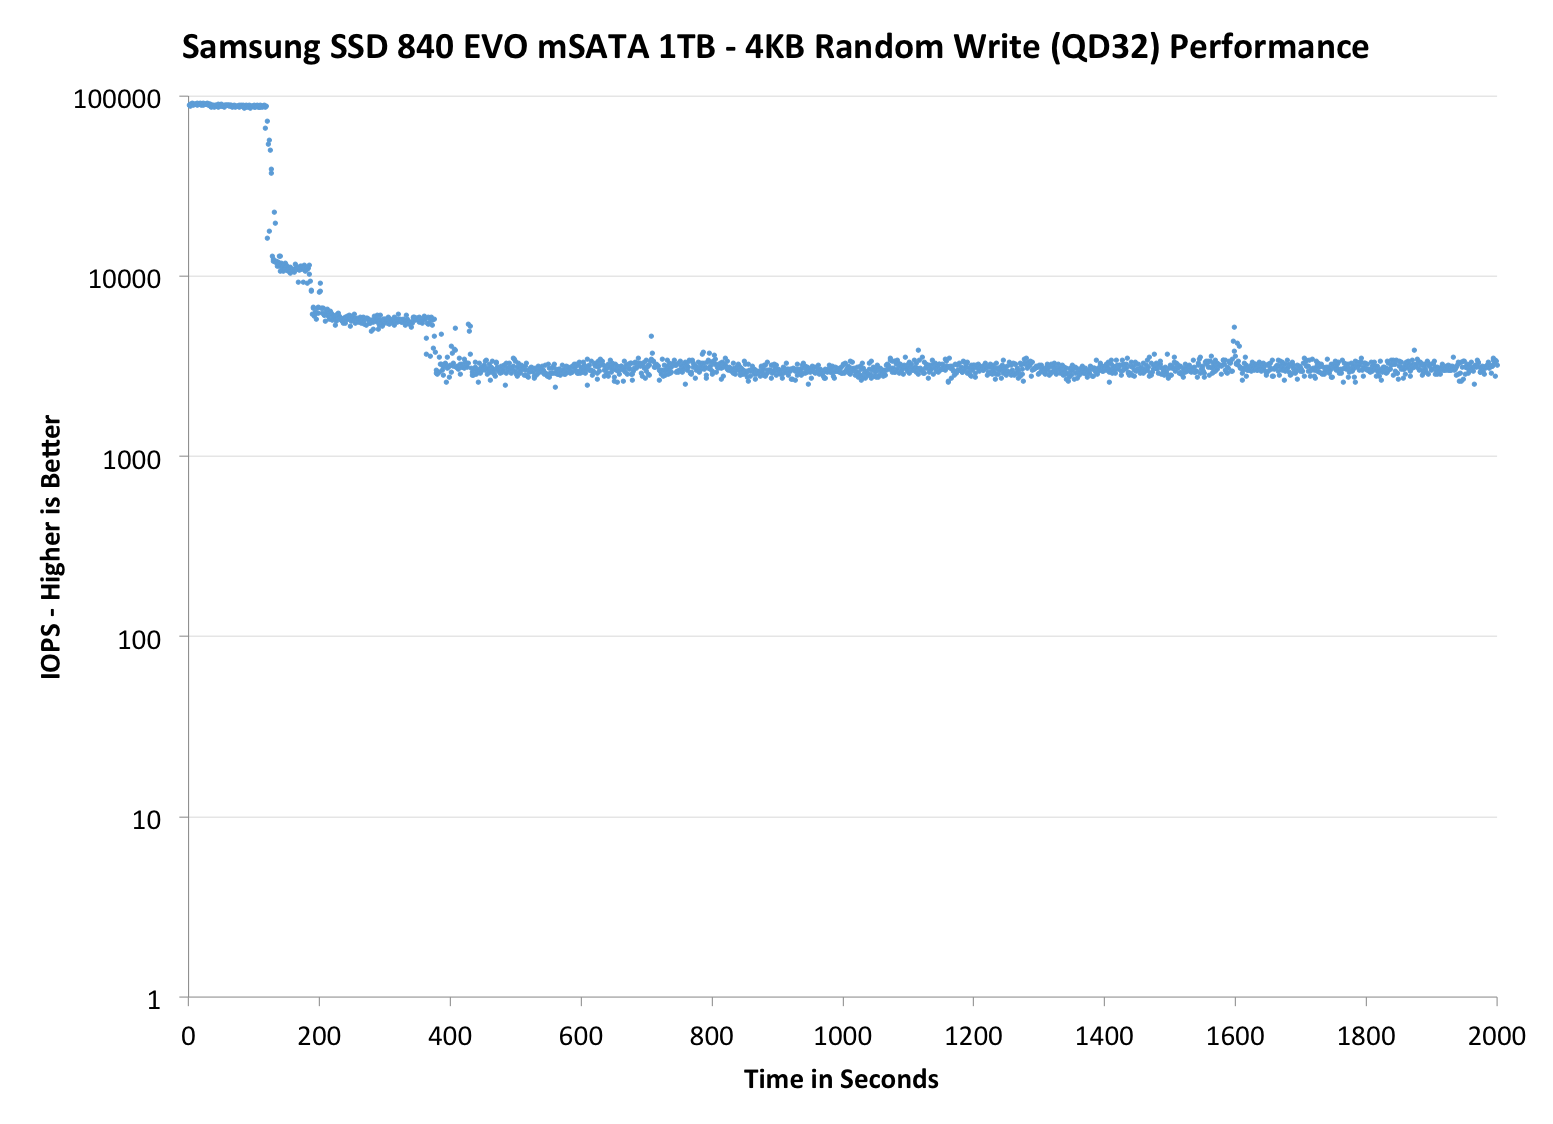
The first set of graphs shows the performance data over the entire 2000 second test period. In these charts you'll notice an early period of very high performance followed by a sharp dropoff. What you're seeing in that case is the drive allocating new blocks from its spare area, then eventually using up all free blocks and having to perform a read-modify-write for all subsequent writes (write amplification goes up, performance goes down).
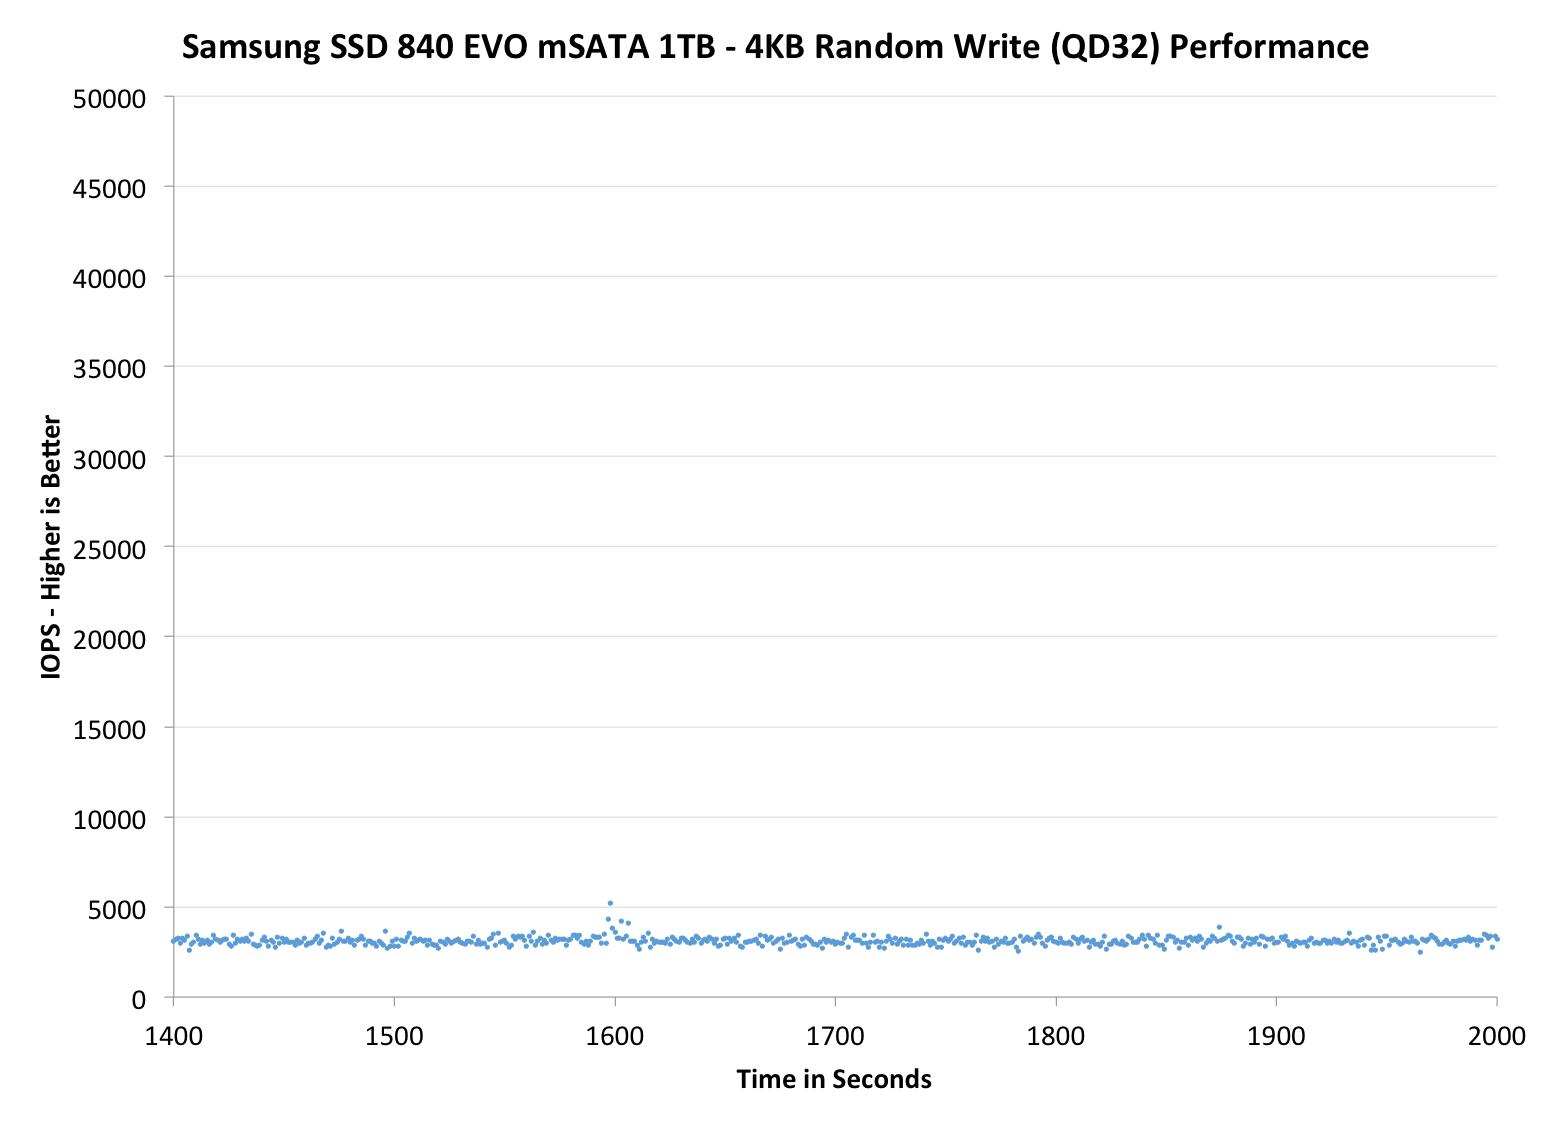
The second set of graphs zooms in to the beginning of steady state operation for the drive (t=1400s). The third set also looks at the beginning of steady state operation but on a linear performance scale. Click the buttons below each graph to switch source data.
 |
|||||||||
| Samsung SSD 840 EVO mSATA 1TB | Mushkin Atlas 240GB | Intel SSD 525 | Plextor M5M | Samsung SSD 840 EVO 1TB | |||||
| Default | |||||||||
| 25% OP | - | - | |||||||
As expected, IO consistency is mostly similar to the regular EVO. The only change appears to be in steady-state behavior where the 2.5" EVO exhibits more up-and-down behavior, whereas the EVO mSATA is more consistent. This might be due to the latest firmware update because it changed some TurboWrite algorithms and it seems that the TurboWrite is kicking in in the 2.5" EVO every once in a while to boost performance (our EVO mSATA has the latest firmware but the 2.5" EVO was tested with the original firmware).
Increasing the OP in the EVO mSATA results in noticeably better performance but also causes some weird behavior. After about 300 seconds, the IOPS repeatedly drops to 1000 until it evens out after 800 seconds. I am not sure what exactly is happening here but I have asked Samsung to check if this is normal and if they can provide an explanation. My educated guess would be TurboWrite (again) because the drive seems to be reorganizing blocks to increase performance back to peak level. If you're focusing too much on reorganizing existing blocks of data, the latency for incoming writes will increase (and IOPS will drop).
 |
|||||||||
| Samsung SSD 840 EVO mSATA 1TB | Mushkin Atlas 240GB | Intel SSD 525 | Plextor M5M | Samsung SSD 840 EVO 1TB | |||||
| Default | |||||||||
| 25% OP | - | - | |||||||
 |
|||||||||
| Samsung SSD 840 EVO mSATA 1TB | Mushkin Atlas 480GB | Intel SSD 525 | Plextor M5M | Samsung SSD 840 EVO 1TB | |||||
| Default | |||||||||
| 25% OP | - | - | |||||||
TRIM Validation
To test TRIM, I first filled all user-accessible LBAs with sequential data and continued with torturing the drive with 4KB random writes (100% LBA, QD=32) for 60 minutes. After the torture I TRIM'ed the drive (quick format in Windows 7/8) and ran HD Tach to make sure TRIM is functional.
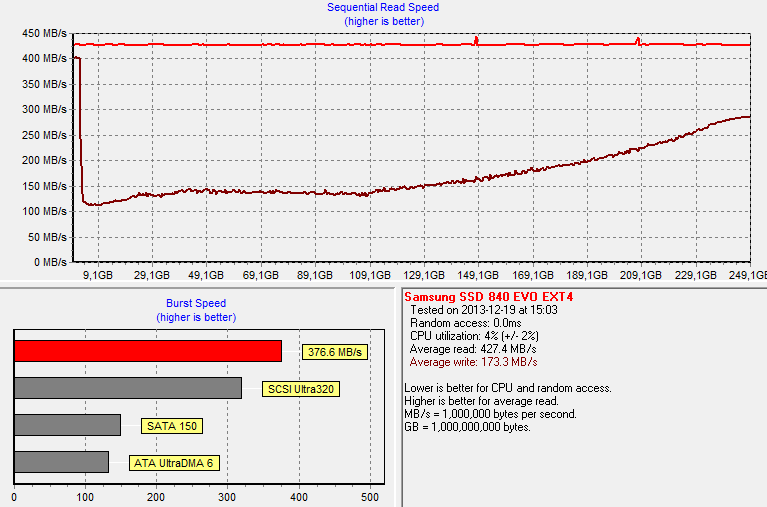
Surprisingly, it's not. The write speed should be around 300MB/s for the 250GB model based on our Iometer test but here the performance is only 100-150MB/s for the earliest LBAs. Sequential writes do restore performance slowly but even after a full drive the performance has not fully recovered.
| Samsung SSD 840 EVO mSATA Resiliency - Iometer Sequential Write | |||
| Clean | Dirty (40min torture) | After TRIM | |
| Samsung SSD 840 EVO mSATA 120GB | 180.4MB/s | 69.3MB/s | 126.2MB/s |
At first I thought this was an error in our testing but I was able to duplicate the issue with our 120GB sample and using Iometer for testing (i.e. 60-second sequential write run in Iometer instead of HD Tach). Unfortunately I ran out of time to test this issue more thoroughly (e.g. does a short period of idling help) but I'll be sure to run more tests once I get back to my testbed.


65 Comments
View All Comments
Brenderick - Saturday, February 15, 2014 - link
mSata was what the commenter wanted.MoFoQ - Friday, January 10, 2014 - link
same hardware?The mSATA version has 4 NAND packages.
The 2.5" version has 8.
Sure, the number of dies total might be the same.
It's like comparing two houses of the same square-footage....except one of them is a two-story house and the other, a single-story one.
With that said, it is an interesting development for mSATA SSDs.
I can't wait until other manufacturers come to market to help drive the price down.
emvonline - Friday, January 10, 2014 - link
16 die packages are possible at all NAND suppliers and it is relatively straight forward to implement. the issue is usually that there is minimal demand for anything requiring it. What percentage of the market is 1TB? I think we are talking less than 3% above 512G for consumers. let me know if I am wrong.TLC is great for Samsung product margins. so far it hasn't led to a cost decrease for consumers.
Samsung's execution is the amazing part. they have good (or great) products in every market at every density. And they have the most aggressive marketing campaign. No one else has been able to achieve this.
Marrixster - Saturday, January 11, 2014 - link
Thanks very much indeed for this review. I already have 2 Samsung PM851 512GB (MZMTE512HMHP-00000). And, just prior to reading this review ordered the 1TB model (MZ-MTE1T0BW).The price is AUD822.99 (ramcity.com.au), very expensive. However, the convenience of this form factor justifies cost from my point of view.
Now, it's simply a matter of deciding which lappy it gets installed in.
Unit Igor - Saturday, January 11, 2014 - link
Tell me Kristian please would EVO 120GB msata have any advantage over EVO 250gb msata in longer battery life when you compare power consumption vs. disk busy times and mb/s.I use my ultrabook only for mails ,sometimes watching movies and surfing.I dont need more then 120GB SSD but i am willing to buy 250Gb if it would give me more battery life.What i wanted to see in your benchmark is MobileMark 2012 because msata is for laptops and that is where battery life play big role.philipma1957 - Sunday, January 12, 2014 - link
the new gigabyte brix with the i7 4770r cpu 16th ram and a 1tb mSata would be really nice gear.nogoms - Monday, January 13, 2014 - link
You start off with the claim that "Samsung is in a unique position in the SSD market. It’s the only company in the consumer SSD business with a fully vertically integrated business model and zero reliance on other companies."This is, however, not actually true. SK Hynix is in a similar position, as they've had their own controllers, NAND, and DRAM since their purchase of LAMD a year and a half ago. Admittedly, they hadn't actually released a completely in-house SSD using a LAMD controller until late last year with the release of the SH 920 series. In fact, the Surface Pro 2 uses an SK Hynix mSATA SSD (with a LAMD controller), as noted in Anand's review and iFixIt's teardown. SK Hynix also doesn't appear to be making the SH920 series available in retail outside of Asia, though Super Talent's Supernova3 series is available in retail in North America (from the likes of SuperBiiz and various third-party sellers on Amazon and Newegg) and appears to be rebranded 2.5" SK Hynix SH920 series drives.
Kristian Vättö - Monday, January 13, 2014 - link
I did mention SK Hynix and LAMD later in the article:"Sure, Samsung isn't the only NAND manufacturer but it is the only one with a consumer orientated controller IP (although SK Hynix owns LAMD now but that deal has yet to materialize in a product)"
The thing is, while Hynix does have a LAMD based SSD, it's the same controller that other's are using. It's possible that Hynix has contributed to the firmware but it's not a fully in-house designed platform (the controller was designed way before the acquisition took place).
nogoms - Monday, January 13, 2014 - link
That statement is also false, as SK Hynix's LAMD controller *has* materialized in products, as I pointed out in my previous post--they're available in complete systems like the Surface Pro 2 worldwide as well as standalone at retail (in East Asia). Also, it's disingenuous to say it's not fully in-house when the controller and firmware were designed and written by teams currently in the employ of SK Hynix, and even if one were to accept your contention that such an arrangement is not "fully in-house designed," the opening statement of the article does not all of a sudden become true, as Samsung is still not the only manufacturer with "a fully integrated business model" or "zero reliance on other companies."Hrel - Monday, January 13, 2014 - link
any idea when we'll be able to get 512GB drives for under $200?