Samsung SSD 840 EVO mSATA (120GB, 250GB, 500GB & 1TB) Review
by Kristian Vättö on January 9, 2014 1:35 PM ESTPerformance Consistency
In our Intel SSD DC S3700 review Anand introduced a new method of characterizing performance: looking at the latency of individual operations over time. The S3700 promised a level of performance consistency that was unmatched in the industry, and as a result needed some additional testing to show that. The reason we don't have consistent IO latency with SSDs is because inevitably all controllers have to do some amount of defragmentation or garbage collection in order to continue operating at high speeds. When and how an SSD decides to run its defrag and cleanup routines directly impacts the user experience. Frequent (borderline aggressive) cleanup generally results in more stable performance, while delaying that can result in higher peak performance at the expense of much lower worst-case performance. The graphs below tell us a lot about the architecture of these SSDs and how they handle internal defragmentation.
To generate the data below we take a freshly secure erased SSD and fill it with sequential data. This ensures that all user accessible LBAs have data associated with them. Next we kick off a 4KB random write workload across all LBAs at a queue depth of 32 using incompressible data. We run the test for just over half an hour, nowhere near what we run our steady state tests for but enough to give a good look at drive behavior once all spare area fills up.
We record instantaneous IOPS every second for the duration of the test and then plot IOPS vs. time and generate the scatter plots below. Each set of graphs features the same scale. The first two sets use a log scale for easy comparison, while the last set of graphs uses a linear scale that tops out at 40K IOPS for better visualization of differences between drives.
The high level testing methodology remains unchanged from our S3700 review. Unlike in previous reviews however, we vary the percentage of the drive that gets filled/tested depending on the amount of spare area we're trying to simulate. The buttons are labeled with the advertised user capacity had the SSD vendor decided to use that specific amount of spare area. If you want to replicate this on your own all you need to do is create a partition smaller than the total capacity of the drive and leave the remaining space unused to simulate a larger amount of spare area. The partitioning step isn't absolutely necessary in every case but it's an easy way to make sure you never exceed your allocated spare area. It's a good idea to do this from the start (e.g. secure erase, partition, then install Windows), but if you are working backwards you can always create the spare area partition, format it to TRIM it, then delete the partition. Finally, this method of creating spare area works on the drives we've tested here but not all controllers are guaranteed to behave the same way.
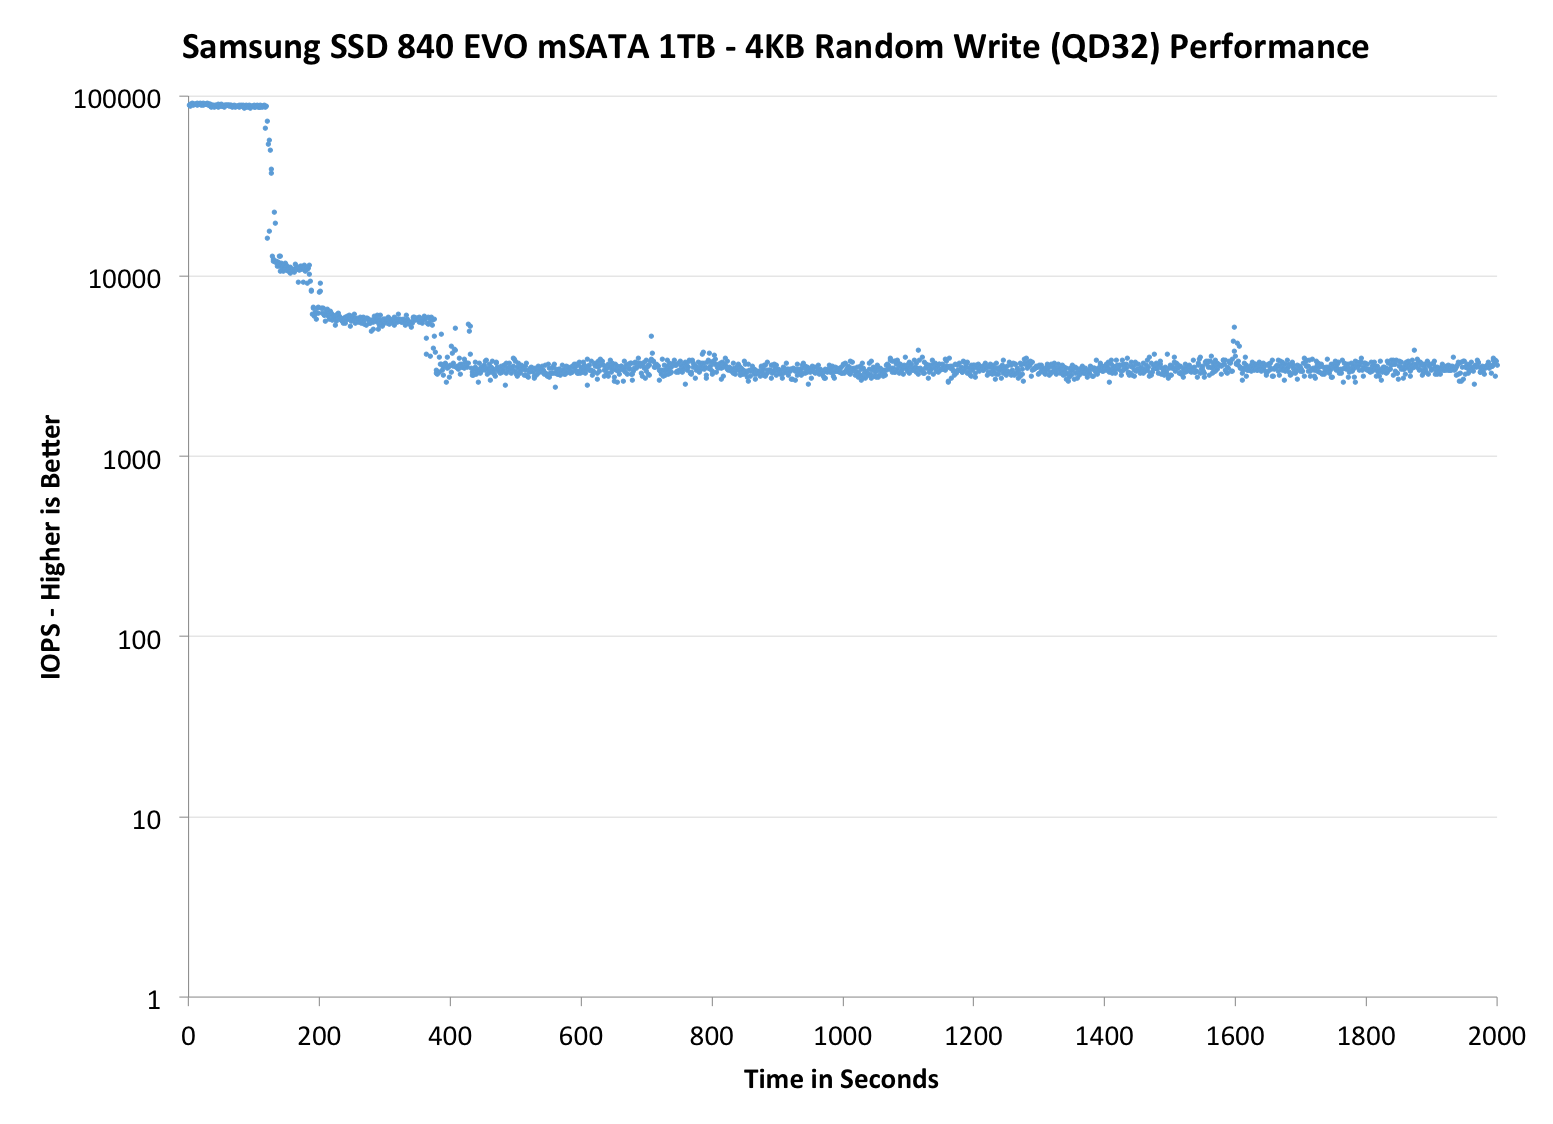
The first set of graphs shows the performance data over the entire 2000 second test period. In these charts you'll notice an early period of very high performance followed by a sharp dropoff. What you're seeing in that case is the drive allocating new blocks from its spare area, then eventually using up all free blocks and having to perform a read-modify-write for all subsequent writes (write amplification goes up, performance goes down).
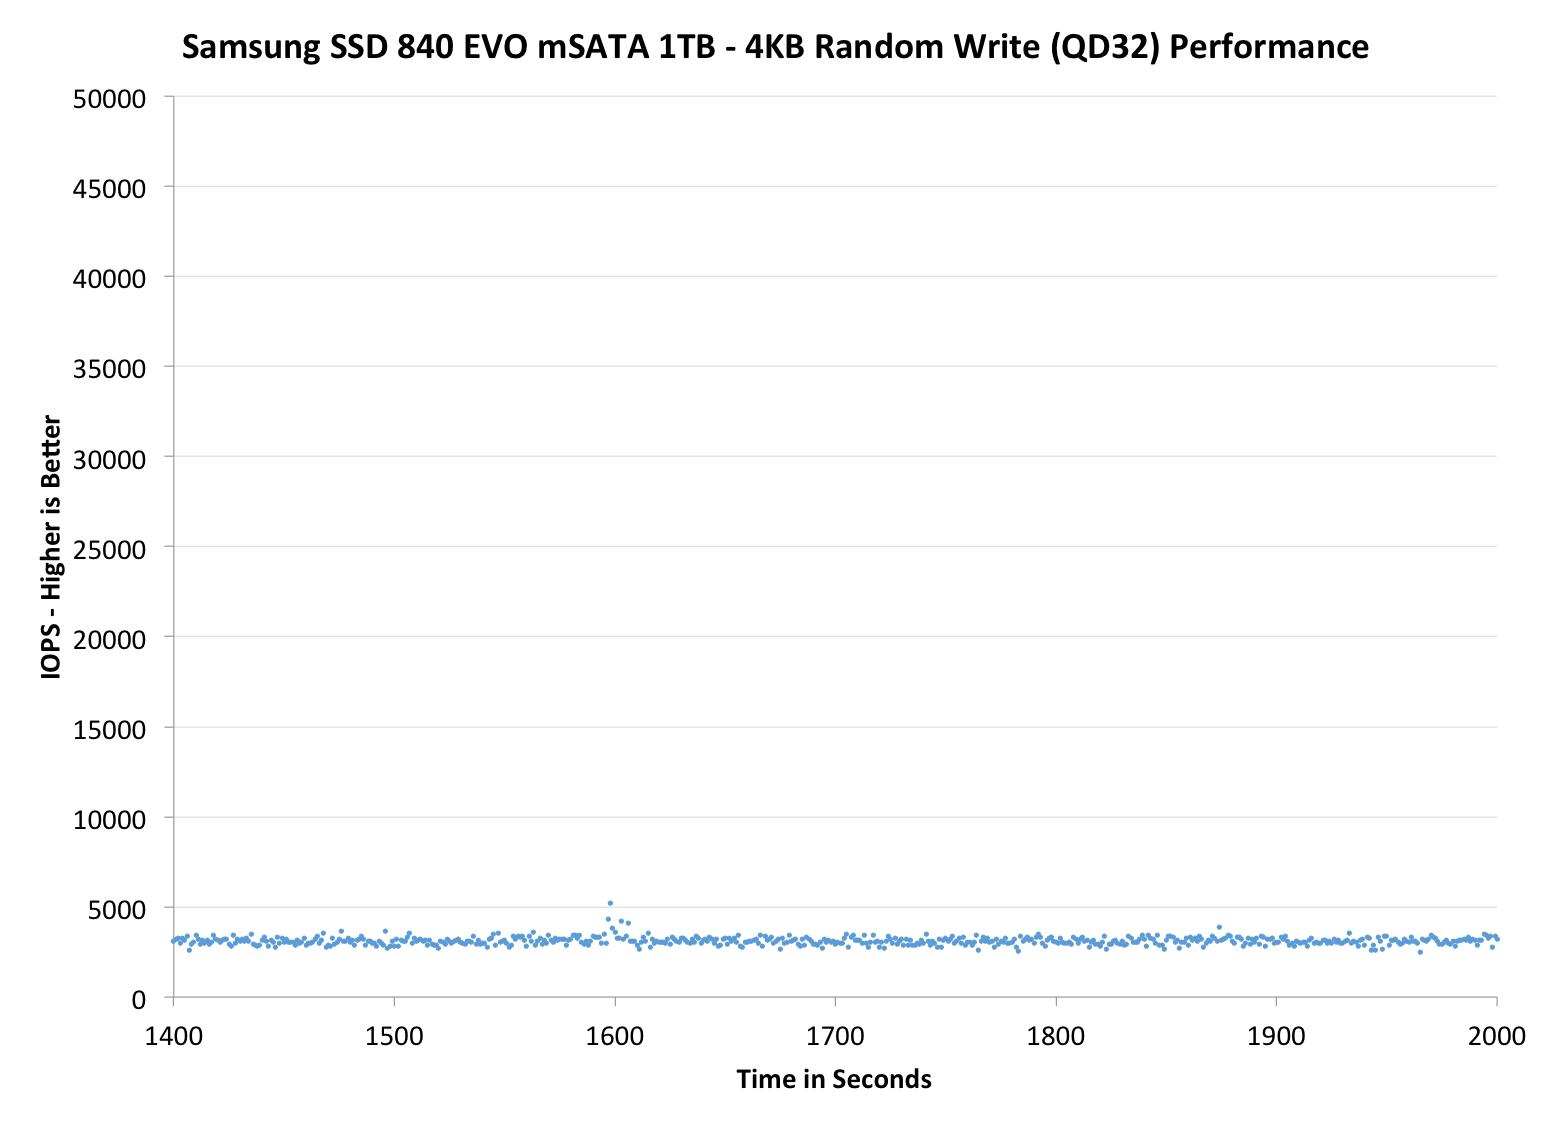
The second set of graphs zooms in to the beginning of steady state operation for the drive (t=1400s). The third set also looks at the beginning of steady state operation but on a linear performance scale. Click the buttons below each graph to switch source data.
 |
|||||||||
| Samsung SSD 840 EVO mSATA 1TB | Mushkin Atlas 240GB | Intel SSD 525 | Plextor M5M | Samsung SSD 840 EVO 1TB | |||||
| Default | |||||||||
| 25% OP | - | - | |||||||
As expected, IO consistency is mostly similar to the regular EVO. The only change appears to be in steady-state behavior where the 2.5" EVO exhibits more up-and-down behavior, whereas the EVO mSATA is more consistent. This might be due to the latest firmware update because it changed some TurboWrite algorithms and it seems that the TurboWrite is kicking in in the 2.5" EVO every once in a while to boost performance (our EVO mSATA has the latest firmware but the 2.5" EVO was tested with the original firmware).
Increasing the OP in the EVO mSATA results in noticeably better performance but also causes some weird behavior. After about 300 seconds, the IOPS repeatedly drops to 1000 until it evens out after 800 seconds. I am not sure what exactly is happening here but I have asked Samsung to check if this is normal and if they can provide an explanation. My educated guess would be TurboWrite (again) because the drive seems to be reorganizing blocks to increase performance back to peak level. If you're focusing too much on reorganizing existing blocks of data, the latency for incoming writes will increase (and IOPS will drop).
 |
|||||||||
| Samsung SSD 840 EVO mSATA 1TB | Mushkin Atlas 240GB | Intel SSD 525 | Plextor M5M | Samsung SSD 840 EVO 1TB | |||||
| Default | |||||||||
| 25% OP | - | - | |||||||
 |
|||||||||
| Samsung SSD 840 EVO mSATA 1TB | Mushkin Atlas 480GB | Intel SSD 525 | Plextor M5M | Samsung SSD 840 EVO 1TB | |||||
| Default | |||||||||
| 25% OP | - | - | |||||||
TRIM Validation
To test TRIM, I first filled all user-accessible LBAs with sequential data and continued with torturing the drive with 4KB random writes (100% LBA, QD=32) for 60 minutes. After the torture I TRIM'ed the drive (quick format in Windows 7/8) and ran HD Tach to make sure TRIM is functional.
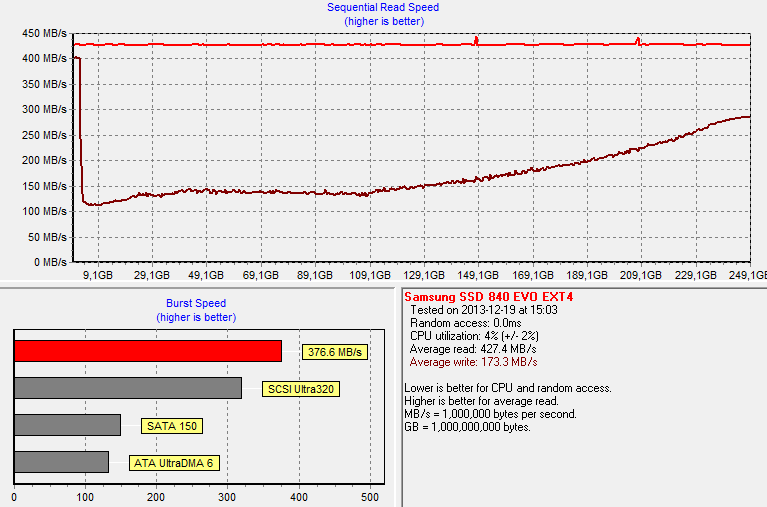
Surprisingly, it's not. The write speed should be around 300MB/s for the 250GB model based on our Iometer test but here the performance is only 100-150MB/s for the earliest LBAs. Sequential writes do restore performance slowly but even after a full drive the performance has not fully recovered.
| Samsung SSD 840 EVO mSATA Resiliency - Iometer Sequential Write | |||
| Clean | Dirty (40min torture) | After TRIM | |
| Samsung SSD 840 EVO mSATA 120GB | 180.4MB/s | 69.3MB/s | 126.2MB/s |
At first I thought this was an error in our testing but I was able to duplicate the issue with our 120GB sample and using Iometer for testing (i.e. 60-second sequential write run in Iometer instead of HD Tach). Unfortunately I ran out of time to test this issue more thoroughly (e.g. does a short period of idling help) but I'll be sure to run more tests once I get back to my testbed.


65 Comments
View All Comments
ahar - Thursday, January 9, 2014 - link
Can we also have one for the article? ;)"...so the number's you're seeing here..."
Unit Igor - Saturday, January 11, 2014 - link
Tell me Kristian please would EVO 120GB msata have any advantage over EVO 250gb msata in longer battery life when you compare power consuptipon vs. disk busy times and mb/s.I use my ultrabook only for mails ,somtimes wathing movies and surfing.I dont need more then 120GB SSD but i am willing to buy 250Gb if it would give me more battery life.What i wanted to see in your benchmark is MobileMark 2012 because msata is for laptops and that is where battery life play big roleguidryp - Thursday, January 9, 2014 - link
"endurance is fine for consumer usage"Thanks for your opinion, but I'll stick with MLC.
Do you also think Multi-TB HDDs are fine for consumer use? Since HDDs went over 1TB, they have been failing/wearing out for me regularly. I am sure you can find some theoretical numbers that say these are "fine for consumer usage" as well.
There is a big trend to bigger sizes but lower reliability. That trend can get stuffed.
Samsungs advantage of Being the only TLC player strikes me as a reason to avoid Samsung, so I can avoid TLC and decreasing endurance that goes with it.
Kristian Vättö - Thursday, January 9, 2014 - link
That's just your experience, it's not a proof that over 1TB hard drives are less reliable. We can't go out and start claiming that they are less reliable unless we have some concrete proof of that (failures on our end, statistics etc).The same applies for TLC. All we have is the P/E cycle number and frankly it gives us a pretty good estimation of the drive's lifespan and those numbers suggest that the endurance of TLC is completely fine for consumer usage. Or do you think our calculations are incorrect?
MrSpadge - Thursday, January 9, 2014 - link
And add to that that the P/E cycles are usually conservatively estimated by manufacturers. The SSD-burn-tests at XS sometimes exceed the ratings significantly.guidryp - Thursday, January 9, 2014 - link
I think if you examine any aggregate source of reviews like Newegg you will see a significant drop in drive satisfaction do to early failures, since drives went over 1TB. So it isn't just some personal fluke that half of my >1TB drives have failed worn out, so far.I am really sick of this trend of declining reliability being sold as good enough. If TLC is "good enough" I will take MLC with 3X "good enough" unless the we are talking about 1/3 the price for TLC.
Weren't the Samsung 840s failing in days for Anand last year?
Unlike reviewers, I use my products until they fail, so reliability matters a LOT, and is something that is going in the wrong direction IMO.
Kristian Vättö - Thursday, January 9, 2014 - link
Reliability is not the same as endurance. TLC has lower endurance, that's a fact, but it's not less reliable. Endurance is something you can predict (in the end all electronics have a finite lifespan) but reliability you cannot since there's a lot else than just NAND that can fail. I would claim that today's SSDs are much more reliable than the SSDs we had two years ago -- there haven't been any widespread issues with current drives (compared to e.g. early SandForce drives).Yes, we had a total of three 840 and 840 Pros that failed but that was on pre-production firmware. The retail units shipped with a fixed firmware.
This isn't a new trend. Historically we can go back all the way to 1920s when light bulb companies started rigging their products so the lifespan would be shorter, which would in turn increase sales. Is it fair? Of course not. Do all companies do it? Yes.
I do see your point but I think you're exaggerating. Even TLC SSDs will easily outlive the computer as a whole since the system will become obsolete in in a matter of years anyway if it's not updated.
gandergray - Saturday, January 25, 2014 - link
For information concerning hard drive failure rates that is more objective, please see the following article: http://www.extremetech.com/extreme/175089-who-make... .althaz - Thursday, January 9, 2014 - link
TLC is NOT a trade off in reliability, but a tradeoff in longevity.Longevity is measured in write-cycles and with heavy consumer loads TLC drives will still last for many years.
bsd228 - Thursday, January 9, 2014 - link
Other than the fact that they both store data, SSDs and HDDs have nothing in common, so it's silly to presume a problem that isn't really what you think it is in the first place. HDDs got dirt cheap as we cross the TB threshold and with it went diligent QA. You want 2TB for $80, you're going to get a higher defect rate. And going to 4 or 5 platters just increases the failure points, but the razor thin margins are the culprit here.In contrast, a bigger SSD just means either more chips, or higher density ones. But 16 chips is nothing new, and since there are no mechanical parts, nothing to worry about. Aside from OCZ, the SSD track record for reliability has been pretty solid, and Samsung (and Intel) far better than that. If you want to stick to 256G in your laptop out of a silly fear of TLC, you're just hurting yourself. The Anand guys have already shown how overstated the wear issue has become.