Mushkin Atlas mSATA (240GB & 480GB) Review
by Kristian Vättö on December 16, 2013 1:10 PM ESTAnandTech Storage Bench 2013
When Anand built the AnandTech Heavy and Light Storage Bench suites in 2011 he did so because we didn't have any good tools at the time that would begin to stress a drive's garbage collection routines. Once all blocks have a sufficient number of used pages, all further writes will inevitably trigger some sort of garbage collection/block recycling algorithm. Our Heavy 2011 test in particular was designed to do just this. By hitting the test SSD with a large enough and write intensive enough workload, we could ensure that some amount of GC would happen.
There were a couple of issues with our 2011 tests that we've been wanting to rectify however. First off, all of our 2011 tests were built using Windows 7 x64 pre-SP1, which meant there were potentially some 4K alignment issues that wouldn't exist had we built the trace on a system with SP1. This didn't really impact most SSDs but it proved to be a problem with some hard drives. Secondly, and more recently, we've shifted focus from simply triggering GC routines to really looking at worst-case scenario performance after prolonged random IO.
For years we'd felt the negative impacts of inconsistent IO performance with all SSDs, but until the S3700 showed up we didn't think to actually measure and visualize IO consistency. The problem with our IO consistency tests is that they are very focused on 4KB random writes at high queue depths and full LBA spans–not exactly a real world client usage model. The aspects of SSD architecture that those tests stress however are very important, and none of our existing tests were doing a good job of quantifying that.
We needed an updated heavy test, one that dealt with an even larger set of data and one that somehow incorporated IO consistency into its metrics. We think we have that test. The new benchmark doesn't even have a name, we've just been calling it The Destroyer (although AnandTech Storage Bench 2013 is likely a better fit for PR reasons).
Everything about this new test is bigger and better. The test platform moves to Windows 8 Pro x64. The workload is far more realistic. Just as before, this is an application trace based test–we record all IO requests made to a test system, then play them back on the drive we're measuring and run statistical analysis on the drive's responses.
Imitating most modern benchmarks Anand crafted the Destroyer out of a series of scenarios. For this benchmark we focused heavily on Photo editing, Gaming, Virtualization, General Productivity, Video Playback and Application Development. Rough descriptions of the various scenarios are in the table below:
| AnandTech Storage Bench 2013 Preview - The Destroyer | ||||||||||||
| Workload | Description | Applications Used | ||||||||||
| Photo Sync/Editing | Import images, edit, export | Adobe Photoshop CS6, Adobe Lightroom 4, Dropbox | ||||||||||
| Gaming | Download/install games, play games | Steam, Deus Ex, Skyrim, Starcraft 2, BioShock Infinite | ||||||||||
| Virtualization | Run/manage VM, use general apps inside VM | VirtualBox | ||||||||||
| General Productivity | Browse the web, manage local email, copy files, encrypt/decrypt files, backup system, download content, virus/malware scan | Chrome, IE10, Outlook, Windows 8, AxCrypt, uTorrent, AdAware | ||||||||||
| Video Playback | Copy and watch movies | Windows 8 | ||||||||||
| Application Development | Compile projects, check out code, download code samples | Visual Studio 2012 | ||||||||||
While some tasks remained independent, many were stitched together (e.g. system backups would take place while other scenarios were taking place). The overall stats give some justification to what we've been calling this test internally:
| AnandTech Storage Bench 2013 Preview - The Destroyer, Specs | |||||||||||||
| The Destroyer (2013) | Heavy 2011 | ||||||||||||
| Reads | 38.83 million | 2.17 million | |||||||||||
| Writes | 10.98 million | 1.78 million | |||||||||||
| Total IO Operations | 49.8 million | 3.99 million | |||||||||||
| Total GB Read | 1583.02 GB | 48.63 GB | |||||||||||
| Total GB Written | 875.62 GB | 106.32 GB | |||||||||||
| Average Queue Depth | ~5.5 | ~4.6 | |||||||||||
| Focus | Worst-case multitasking, IO consistency | Peak IO, basic GC routines | |||||||||||
SSDs have grown in their performance abilities over the years, so we wanted a new test that could really push high queue depths at times. The average queue depth is still realistic for a client workload, but the Destroyer has some very demanding peaks. When we first introduced the Heavy 2011 test, some drives would take multiple hours to complete it; today most high performance SSDs can finish the test in under 90 minutes. The Destroyer? So far the fastest we've seen it go is 10 hours. Most high performance SSDs we've tested seem to need around 12–13 hours per run, with mainstream drives taking closer to 24 hours. The read/write balance is also a lot more realistic than in the Heavy 2011 test. Back in 2011 we just needed something that had a ton of writes so we could start separating the good from the bad. Now that the drives have matured, we felt a test that was a bit more balanced would be a better idea.
Despite the balance recalibration, there's just a ton of data moving around in this test. Ultimately the sheer volume of data here and the fact that there's a good amount of random IO courtesy of all of the multitasking (e.g. background VM work, background photo exports/syncs, etc...) makes the Destroyer do a far better job of giving credit for performance consistency than the old Heavy 2011 test. Both tests are valid; they just stress/showcase different things. As the days of begging for better random IO performance and basic GC intelligence are over, we wanted a test that would give us a bit more of what we're interested in these days. As Anand mentioned in the S3700 review, having good worst-case IO performance and consistency matters just as much to client users as it does to enterprise users.
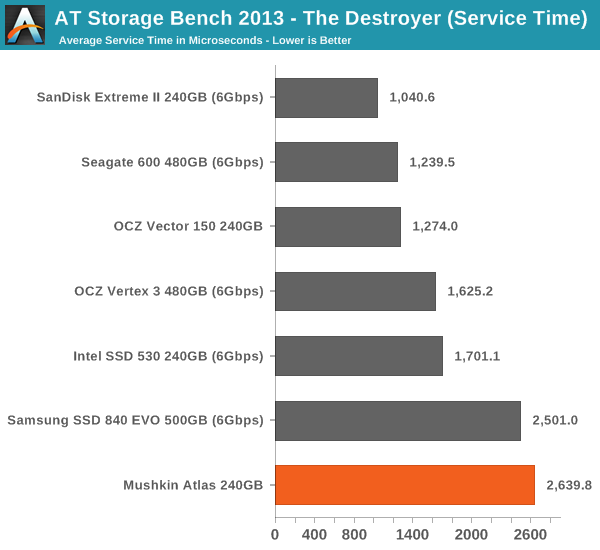
We're reporting two primary metrics with the Destroyer: average data rate in MB/s and average service time in microseconds. The former gives you an idea of the throughput of the drive during the time that it was running the Destroyer workload. This can be a very good indication of overall performance. What average data rate doesn't do a good job of is taking into account response time of very bursty (read: high queue depth) IO. By reporting average service time we heavily weigh latency for queued IOs. You'll note that this is a metric we've been reporting in our enterprise benchmarks for a while now. With the client tests maturing, the time was right for a little convergence.
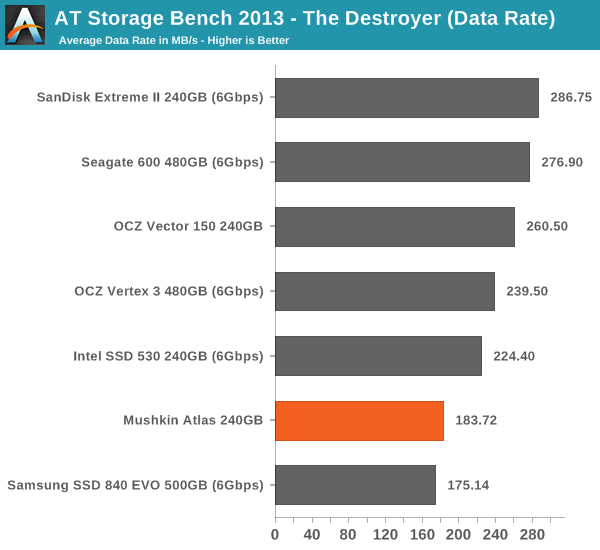
Even though the Atlas has good IO consistency, it doesn't perform that well in our new Storage Bench 2013. As the service time graph below suggests, the Atlas has biggest trouble when the queue depth is high (it's more stressful and it takes longer for each IO to complete when the QD is high). I'm guessing that this might be due to thermal throttling because mSATA SSDs don't have a metal casing acting as a heatsink but it may as well be due to firmware differences.


27 Comments
View All Comments
henrybravo - Monday, December 16, 2013 - link
Perhaps you should go back and read the 2 paragraphs in the power consumption section. They used an mSATA adapter with a voltage regulator, which caused the power consumption numbers to be artificially high. Kristian speculates the true power draw of the drive is actually comparable to the Intel SSD 525.whyso - Tuesday, December 17, 2013 - link
"Hence the numbers for mSATA drives are not accurate because the voltage regulator consumes some of the power." I was assuming they are using the same adapter for all the drives (which they say plural).Kristian Vättö - Tuesday, December 17, 2013 - link
The same adapter was used with Plextor M5M and MyDigitalSSD's SSDs. I'm currently trying to set it up so that the voltage/current going straight to the drive could be measured. Will update if I get it working...phantom505 - Monday, December 30, 2013 - link
Pretty poor reading comprehension. The voltage regulator eats 40-50% of that value. Seems relatively speaking on par.kraki - Monday, December 16, 2013 - link
As a long time Mushkin customer who has 3 of the Chronos Deluxe 240s in his desktop even I had to go with the M5Ms as well in my new laptop. I disagree on the "Performance isn't important" comment though. Silent, fast and light were my reasons for getting 2 Plextor M5Ms in my new system.tomtetummetott - Tuesday, December 17, 2013 - link
just curious: is there any reason to buy this over a Crucial M500 mSATA?Kristian Vättö - Tuesday, December 17, 2013 - link
We haven't tested the M500 mSATA yet (I've asked for samples and they should be here after CES) but my wild guess would be no.asgallant - Tuesday, December 17, 2013 - link
Is it possible that the performance deficit for the 480GB is due to using LGA60 for the packaging instead of LBGA100? A priori, one might expect to see bandwidth per package to correlate with pin count, ergo lower performance from lower pin count.Kristian Vättö - Tuesday, December 17, 2013 - link
That's a good point. Some OEMs have changed the package type for better performance, you're probably right that the package type is at least partially reason to the lower performance. However, I think the main reason is still the increased page/block count since the 480GB Vertex 3 showed similar behaviour.Menetlaus - Tuesday, December 17, 2013 - link
Screw mSATA... where are the retail NGFF/M.2 SSD's and their reviews?I've got a Lenovo Y410p with a useless 32gb 4280 (I think) M.2 cache SSD... I'd love to drop in a 120/250GB SSD and use it for the OS drive, but there are few (if any) M.2's readivly available in Canada (amazon.COM had two, but no ship to Canada).
Can you tell I'm more than a little ticked at Lenovo as they assured me prior to purchase it had a mSATA SSD, but I suppose this is another case of may the buyer beware.