OCZ Vector 150 (120GB & 240GB) Review
by Kristian Vättö on November 7, 2013 9:00 AM EST- Posted in
- Storage
- SSDs
- OCZ
- Indilinx
- Vector 150
AnandTech Storage Bench 2013
When Anand built the AnandTech Heavy and Light Storage Bench suites in 2011 he did so because we didn't have any good tools at the time that would begin to stress a drive's garbage collection routines. Once all blocks have a sufficient number of used pages, all further writes will inevitably trigger some sort of garbage collection/block recycling algorithm. Our Heavy 2011 test in particular was designed to do just this. By hitting the test SSD with a large enough and write intensive enough workload, we could ensure that some amount of GC would happen.
There were a couple of issues with our 2011 tests that we've been wanting to rectify however. First off, all of our 2011 tests were built using Windows 7 x64 pre-SP1, which meant there were potentially some 4K alignment issues that wouldn't exist had we built the trace on a system with SP1. This didn't really impact most SSDs but it proved to be a problem with some hard drives. Secondly, and more recently, we've shifted focus from simply triggering GC routines to really looking at worst-case scenario performance after prolonged random IO.
For years we'd felt the negative impacts of inconsistent IO performance with all SSDs, but until the S3700 showed up we didn't think to actually measure and visualize IO consistency. The problem with our IO consistency tests is that they are very focused on 4KB random writes at high queue depths and full LBA spans—not exactly a real world client usage model. The aspects of SSD architecture that those tests stress however are very important, and none of our existing tests were doing a good job of quantifying that.
We needed an updated heavy test, one that dealt with an even larger set of data and one that somehow incorporated IO consistency into its metrics. We think we have that test. The new benchmark doesn't even have a name, we've just been calling it The Destroyer (although AnandTech Storage Bench 2013 is likely a better fit for PR reasons).
Everything about this new test is bigger and better. The test platform moves to Windows 8 Pro x64. The workload is far more realistic. Just as before, this is an application trace based test—we record all IO requests made to a test system, then play them back on the drive we're measuring and run statistical analysis on the drive's responses.
Imitating most modern benchmarks Anand crafted the Destroyer out of a series of scenarios. For this benchmark we focused heavily on Photo editing, Gaming, Virtualization, General Productivity, Video Playback and Application Development. Rough descriptions of the various scenarios are in the table below:
| AnandTech Storage Bench 2013 Preview -- The Destroyer | ||||||||||||
| Workload | Description | Applications Used | ||||||||||
| Photo Sync/Editing | Import images, edit, export | Adobe Photoshop CS6, Adobe Lightroom 4, Dropbox | ||||||||||
| Gaming | Download/install games, play games | Steam, Deus Ex, Skyrim, Starcraft 2, BioShock Infinite | ||||||||||
| Virtualization | Run/manage VM, use general apps inside VM | VirtualBox | ||||||||||
| General Productivity | Browse the web, manage local email, copy files, encrypt/decrypt files, backup system, download content, virus/malware scan | Chrome, IE10, Outlook, Windows 8, AxCrypt, uTorrent, AdAware | ||||||||||
| Video Playback | Copy and watch movies | Windows 8 | ||||||||||
| Application Development | Compile projects, check out code, download code samples | Visual Studio 2012 | ||||||||||
While some tasks remained independent, many were stitched together (e.g. system backups would take place while other scenarios were taking place). The overall stats give some justification to what we've been calling this test internally:
| AnandTech Storage Bench 2013 Preview -- The Destroyer, Specs | |||||||||||||
| The Destroyer (2013) | Heavy 2011 | ||||||||||||
| Reads | 38.83 million | 2.17 million | |||||||||||
| Writes | 10.98 million | 1.78 million | |||||||||||
| Total IO Operations | 49.8 million | 3.99 million | |||||||||||
| Total GB Read | 1583.02 GB | 48.63 GB | |||||||||||
| Total GB Written | 875.62 GB | 106.32 GB | |||||||||||
| Average Queue Depth | ~5.5 | ~4.6 | |||||||||||
| Focus | Worst-case multitasking, IO consistency | Peak IO, basic GC routines | |||||||||||
SSDs have grown in their performance abilities over the years, so we wanted a new test that could really push high queue depths at times. The average queue depth is still realistic for a client workload, but the Destroyer has some very demanding peaks. When we first introduced the Heavy 2011 test, some drives would take multiple hours to complete it; today most high performance SSDs can finish the test in under 90 minutes. The Destroyer? So far the fastest we've seen it go is 10 hours. Most high performance SSDs we've tested seem to need around 12—13 hours per run, with mainstream drives taking closer to 24 hours. The read/write balance is also a lot more realistic than in the Heavy 2011 test. Back in 2011 we just needed something that had a ton of writes so we could start separating the good from the bad. Now that the drives have matured, we felt a test that was a bit more balanced would be a better idea.
Despite the balance recalibration, there's just a ton of data moving around in this test. Ultimately the sheer volume of data here and the fact that there's a good amount of random IO courtesy of all of the multitasking (e.g. background VM work, background photo exports/syncs, etc...) makes the Destroyer do a far better job of giving credit for performance consistency than the old Heavy 2011 test. Both tests are valid; they just stress/showcase different things. As the days of begging for better random IO performance and basic GC intelligence are over, we wanted a test that would give us a bit more of what we're interested in these days. As Anand mentioned in the S3700 review, having good worst-case IO performance and consistency matters just as much to client users as it does to enterprise users.
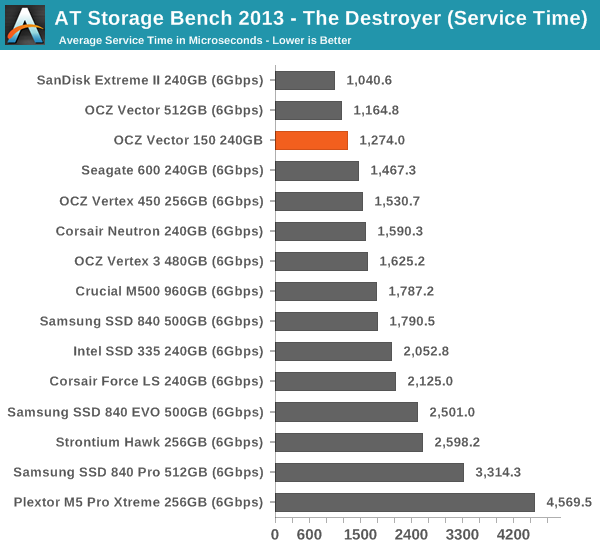
We're reporting two primary metrics with the Destroyer: average data rate in MB/s and average service time in microseconds. The former gives you an idea of the throughput of the drive during the time that it was running the Destroyer workload. This can be a very good indication of overall performance. What average data rate doesn't do a good job of is taking into account response time of very bursty (read: high queue depth) IO. By reporting average service time we heavily weigh latency for queued IOs. You'll note that this is a metric we've been reporting in our enterprise benchmarks for a while now. With the client tests maturing, the time was right for a little convergence.
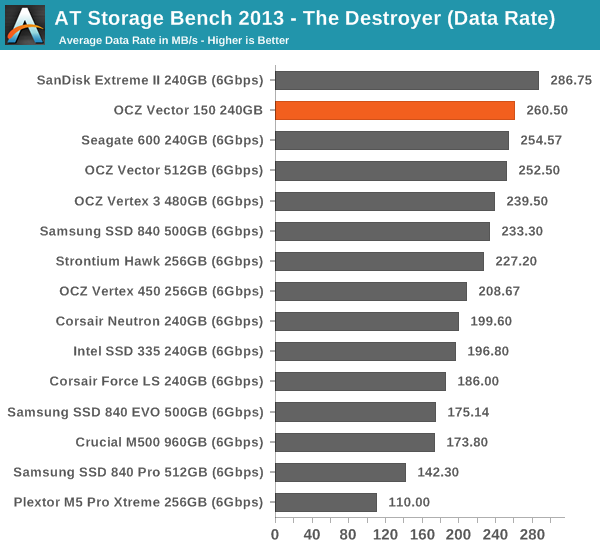
Like the performance consistency test hinted, the Vector 150 is top notch in terms of performance. SanDisk's Extreme II remains unbeatable but the Vector is the second fastest SSD in our new Storage Bench 2013. The original Vector has better average service time, but keep in mind that we're dealing with different capacities (240GB vs 512GB) -- steady-state performance usually scales up a little with more NAND. However, the difference between Vector 150 and Vertex 450 is significant.


59 Comments
View All Comments
DarkKnight_Y2K - Friday, November 8, 2013 - link
I have 2 60GB Vertex 2 in RAID-0 that I bought in 2009, that I still boot to as of today with no problems.profquatermass - Friday, November 8, 2013 - link
Me 2!A Vertex 3. I think most people don't bother ensuring they've got current Firmware in them when buying from a shop.
Shops (brick or online) are notorious for keeping old stock on their shelves.
Also make sure it is partition aligned correctly.
Pantsu - Friday, November 8, 2013 - link
I've been using a 128 GB Vertex 3 since they launched it back in 2011. It had the blue screen issue but that got fixed after a firmware update. It's been working great ever since. Too bad for OCZ, looks like they're beyond hope at this point. Based on the comments their reputation has been soiled, and they'd need a miracle to keep going.derzerb - Thursday, November 7, 2013 - link
I've been using ocz products in several builds psu/ssds and never had any issues. The current affordable prices for ssds is partially attributable to ocz's aggressive pricing in the past.mayankleoboy1 - Thursday, November 7, 2013 - link
isnt the metric "4k random read at QD=1/2the only relefant metric for 80% of a typical desktop workload ?
In that metric, Samsung 840Pro still rules.
JellyRoll - Friday, November 8, 2013 - link
Exactly correct. QD 1-3 are all that matter....not Destroyer benchmarks with insane workloads.Gigaplex - Friday, November 8, 2013 - link
I'm confused as to why the 4K random reads are so slow. Much slower than writing. Anyone care to explain?Kristian Vättö - Friday, November 8, 2013 - link
Random writes can take advantage of write combining (i.e. small IOs are combined to make look like one big IO), which in turn will allow higher level of parallelism as the operation can be spread to a number of die.With random reads that is not possible because when the host sends a read IO request, the controller can't wait to combine it with more reads because that would add unnecessary latency (which means whatever you're doing will slow down because the OS is waiting for your SSD). Low queue depth random reads cannot take much advantage of parallelism because at QD=3, the controller can only read from three dies simultaneously (decrease QD to 1 and it can only read from one die).
piroroadkill - Friday, November 8, 2013 - link
Not bad in a review, but the review sample did die.While better alternatives exist, most people would avoid the OCZ brand like the plague, and that's the sad fact of the matter for OCZ.
I too can throw my anecdote into the ring with a Vertex 2 that gave random trouble. I RMA'd it, and the replacement sees only light duty in a seldom used laptop.
BlakKW - Friday, November 8, 2013 - link
I have 2 ssd's, both would be considered the cheaper "consumer" quality, and usage would be considered very light. Would spending extra on an enterprise level ssd with higher warranty get me a drive that lasts a good bit longer?