Intel SSD 530 (240GB) Review
by Kristian Vättö on November 15, 2013 1:45 PM EST- Posted in
- Storage
- SSDs
- Intel
- Intel SSD 530
AnandTech Storage Bench 2011
Two years ago we introduced our AnandTech Storage Bench, a suite of benchmarks that took traces of real OS/application usage and played them back in a repeatable manner. Anand assembled the traces out of frustration with the majority of what we have today in terms of SSD benchmarks.
Although the AnandTech Storage Bench tests did a good job of characterizing SSD performance, they weren't stressful enough. All of the tests performed less than 10GB of reads/writes and typically involved only 4GB of writes specifically. That's not even enough exceed the spare area on most SSDs. Most canned SSD benchmarks don't even come close to writing a single gigabyte of data, but that doesn't mean that simply writing 4GB is acceptable.
Originally I kept the benchmarks short enough that they wouldn't be a burden to run (~30 minutes) but long enough that they were representative of what a power user might do with their system.
Not too long ago I tweeted that I had created what I referred to as the Mother of All SSD Benchmarks (MOASB). Rather than only writing 4GB of data to the drive, this benchmark writes 106.32GB. It's the load you'd put on a drive after nearly two weeks of constant usage. And it takes a *long* time to run.
1) The MOASB, officially called AnandTech Storage Bench 2011 - Heavy Workload, mainly focuses on the times when your I/O activity is the highest. There is a lot of downloading and application installing that happens during the course of this test. My thinking was that it's during application installs, file copies, downloading and multitasking with all of this that you can really notice performance differences between drives.
2) I tried to cover as many bases as possible with the software I incorporated into this test. There's a lot of photo editing in Photoshop, HTML editing in Dreamweaver, web browsing, game playing/level loading (Starcraft II & WoW are both a part of the test) as well as general use stuff (application installing, virus scanning). I included a large amount of email downloading, document creation and editing as well. To top it all off I even use Visual Studio 2008 to build Chromium during the test.
The test has 2,168,893 read operations and 1,783,447 write operations. The IO breakdown is as follows:
| AnandTech Storage Bench 2011 - Heavy Workload IO Breakdown | ||||
| IO Size | % of Total | |||
| 4KB | 28% | |||
| 16KB | 10% | |||
| 32KB | 10% | |||
| 64KB | 4% | |||
Only 42% of all operations are sequential, the rest range from pseudo to fully random (with most falling in the pseudo-random category). Average queue depth is 4.625 IOs, with 59% of operations taking place in an IO queue of 1.
Many of you have asked for a better way to really characterize performance. Simply looking at IOPS doesn't really say much. As a result I'm going to be presenting Storage Bench 2011 data in a slightly different way. We'll have performance represented as Average MB/s, with higher numbers being better. At the same time I'll be reporting how long the SSD was busy while running this test. These disk busy graphs will show you exactly how much time was shaved off by using a faster drive vs. a slower one during the course of this test. Finally, I will also break out performance into reads, writes and combined. The reason I do this is to help balance out the fact that this test is unusually write intensive, which can often hide the benefits of a drive with good read performance.
There's also a new light workload for 2011. This is a far more reasonable, typical every day use case benchmark. Lots of web browsing, photo editing (but with a greater focus on photo consumption), video playback as well as some application installs and gaming. This test isn't nearly as write intensive as the MOASB but it's still multiple times more write intensive than what we were running in 2010.
As always I don't believe that these two benchmarks alone are enough to characterize the performance of a drive, but hopefully along with the rest of our tests they will help provide a better idea.
The testbed for Storage Bench 2011 has changed as well. We're now using a Sandy Bridge platform with full 6Gbps support for these tests.
AnandTech Storage Bench 2011 - Heavy Workload
We'll start out by looking at average data rate throughout our new heavy workload test:
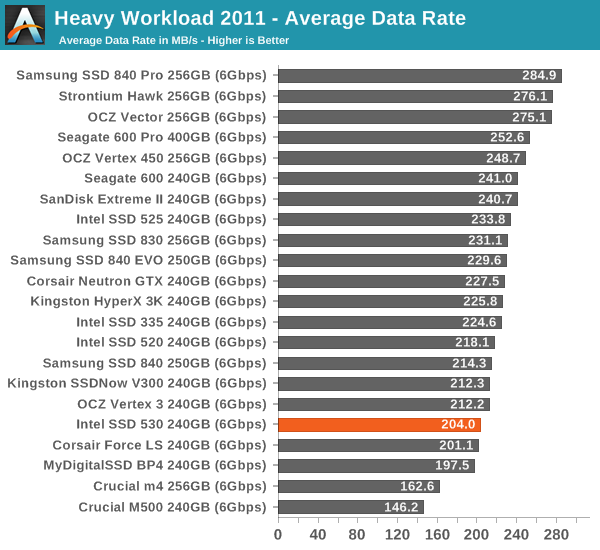
Performance in our 2011 Storage Bench is a bit below the average of SF-2281, although the difference isn't anything to worry about. I decided to include only the most important graphs but you can find the complete dataset in our Bench.
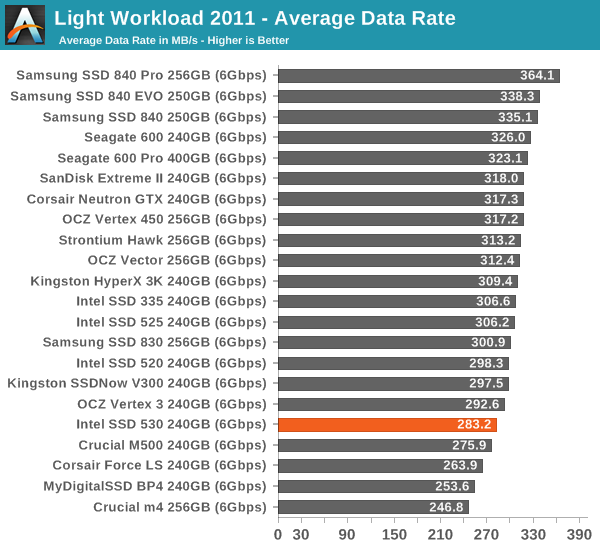
AnandTech Storage Bench 2011 - Light Workload
Our light workload actually has more write operations than read operations. The split is as follows: 372,630 reads and 459,709 writes. The relatively close read/write ratio does better mimic a typical light workload (although even lighter workloads would be far more read centric).
The I/O breakdown is similar to the heavy workload at small IOs, however you'll notice that there are far fewer large IO transfers:
| AnandTech Storage Bench 2011 - Light Workload IO Breakdown | ||||
| IO Size | % of Total | |||
| 4KB | 27% | |||
| 16KB | 8% | |||
| 32KB | 6% | |||
| 64KB | 5% | |||


60 Comments
View All Comments
dynamited - Friday, November 15, 2013 - link
I count seven asus motherboards with mPCIE, not one, at newegg. Regarding 6bps sata saturated, just run with RAID 0, is that hard to figure out how to do?ExodusC - Friday, November 15, 2013 - link
I don't think TRIM commands can be passed through to SSDs running in RAID 0. At one point the Intel storage drivers supported this, but I heard that this had been pulled. I can't find any documentation on this.Additionally, even though SSDs are fairly reliable, adding another drive simply adds another point for failure.
Wetworkz - Friday, November 15, 2013 - link
You CAN pass TRIM commands through to SSDs running in Raid 0 on Intel hardware. It has NOT been pulled. You need to have the latest Intel Toolbox in combination with the latest RST drivers installed. I just TRIMMED both my arrays a couple days ago.ExodusC - Friday, November 15, 2013 - link
Out of curiosity, is that an automated process, or does it require manual TRIM through the Intel SSD Toolbox? What RAID levels are supported?I also wonder about the compressibility of striped data and if there is any effect there.
Samus - Friday, November 15, 2013 - link
I pass TRIM to my RAID 0 Samsung 840 RAID through the Windows 8 defrag on my H87 chipset. Performance tests prove it works. Unfortunately if I have the IRST software installed the drives are downgraded to SATA 3Gbps. I tried different cables and everything. Uninstalling the IRST software after making the RAID 0 restores them to 6Gbps...DMCalloway - Friday, November 15, 2013 - link
It was my understanding that TRIM worked in RAID 0 with the newer RST drivers, but only on Intel 7 series chipsets and newer. I do like Intel products but this is one thing they shafted us on.Wetworkz - Saturday, November 16, 2013 - link
I just TRIMMED both my arrays a few days ago and one array was on an Intel 6 series chipset. I know that series 6 was not previously supported but I was able to initiate TRIM on the array with the newest Intel Toolbox and the newest RST drivers for the first time the other day. I cannot confirm this is officially supported behavior but I was able to do it with the newest drivers. I would give it a try if you have a series 6 board.'nar - Monday, November 18, 2013 - link
I don't really care about TRIM. Garbage Collection works better anyway, especially on SandForce drives.extide - Friday, November 15, 2013 - link
mPCIE is not the same as M.2dynamited - Friday, November 15, 2013 - link
I believe they are calling it "mPCIe Combo Card" which actually has two connects to one on the motherboard.