Corsair Force LS (240GB) Review
by Kristian Vättö on September 25, 2013 12:00 AM ESTPerformance Consistency
In our Intel SSD DC S3700 review Anand introduced a new method of characterizing performance: looking at the latency of individual operations over time. The S3700 promised a level of performance consistency that was unmatched in the industry, and as a result needed some additional testing to show that. The reason we don't have consistent IO latency with SSDs is because inevitably all controllers have to do some amount of defragmentation or garbage collection in order to continue operating at high speeds. When and how an SSD decides to run its defrag and cleanup routines directly impacts the user experience. Frequent (borderline aggressive) cleanup generally results in more stable performance, while delaying that can result in higher peak performance at the expense of much lower worst-case performance. The graphs below tell us a lot about the architecture of these SSDs and how they handle internal defragmentation.
To generate the data below we take a freshly secure erased SSD and fill it with sequential data. This ensures that all user accessible LBAs have data associated with them. Next we kick off a 4KB random write workload across all LBAs at a queue depth of 32 using incompressible data. We run the test for just over half an hour, nowhere near what we run our steady state tests for but enough to give a good look at drive behavior once all spare area fills up.
We record instantaneous IOPS every second for the duration of the test and then plot IOPS vs. time and generate the scatter plots below. Each set of graphs features the same scale. The first two sets use a log scale for easy comparison, while the last set of graphs uses a linear scale that tops out at 40K IOPS for better visualization of differences between drives.
The high level testing methodology remains unchanged from our S3700 review. Unlike in previous reviews however, we vary the percentage of the drive that gets filled/tested depending on the amount of spare area we're trying to simulate. The buttons are labeled with the advertised user capacity had the SSD vendor decided to use that specific amount of spare area. If you want to replicate this on your own all you need to do is create a partition smaller than the total capacity of the drive and leave the remaining space unused to simulate a larger amount of spare area. The partitioning step isn't absolutely necessary in every case but it's an easy way to make sure you never exceed your allocated spare area. It's a good idea to do this from the start (e.g. secure erase, partition, then install Windows), but if you are working backwards you can always create the spare area partition, format it to TRIM it, then delete the partition. Finally, this method of creating spare area works on the drives we've tested here but not all controllers are guaranteed to behave the same way.
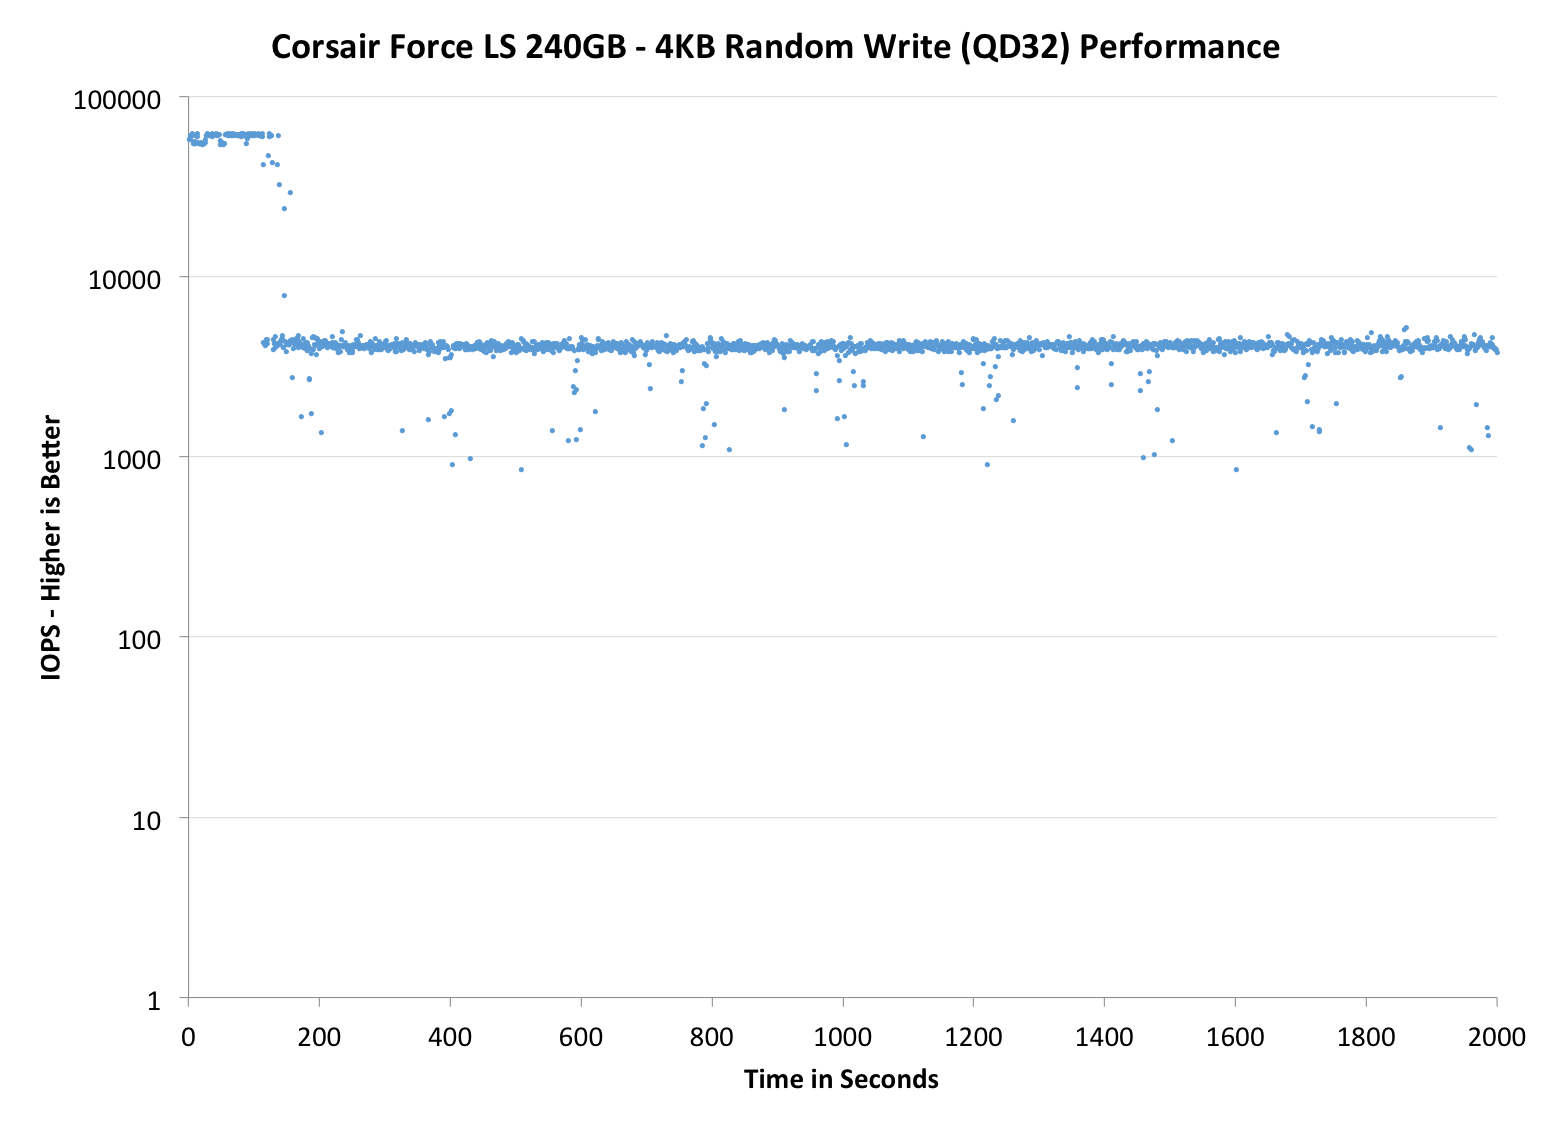
The first set of graphs shows the performance data over the entire 2000 second test period. In these charts you'll notice an early period of very high performance followed by a sharp dropoff. What you're seeing in that case is the drive allocating new blocks from its spare area, then eventually using up all free blocks and having to perform a read-modify-write for all subsequent writes (write amplification goes up, performance goes down).
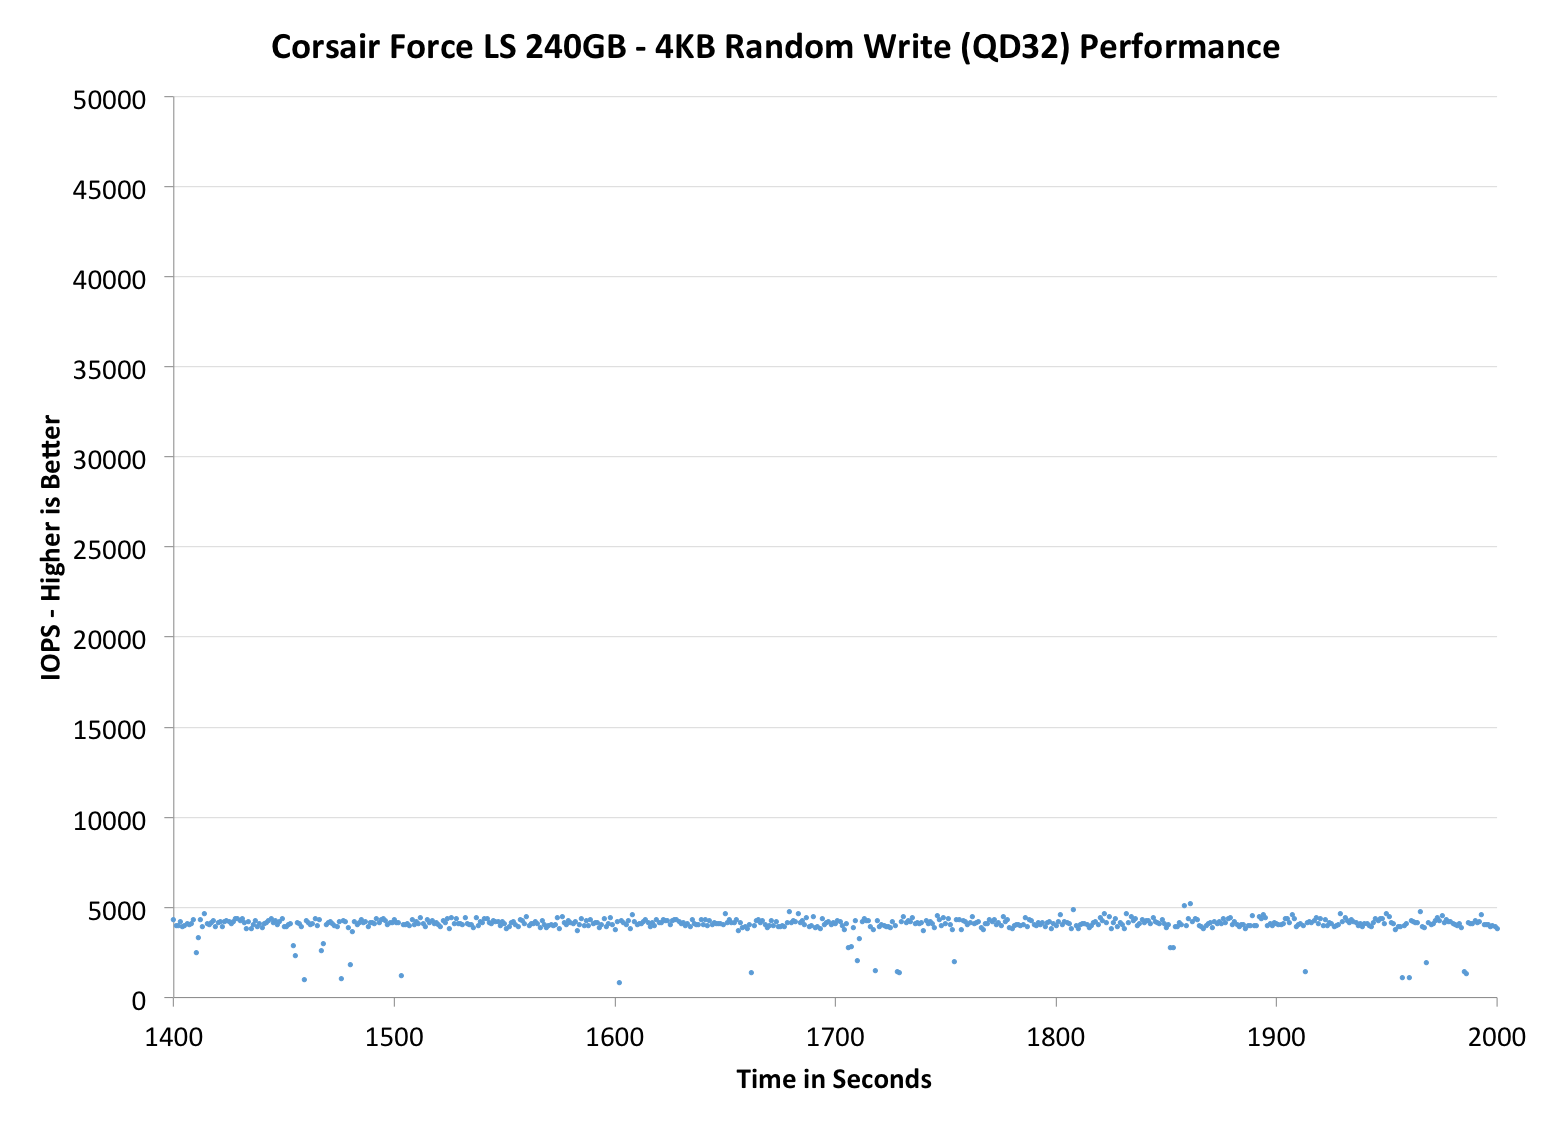
The second set of graphs zooms in to the beginning of steady state operation for the drive (t=1400s). The third set also looks at the beginning of steady state operation but on a linear performance scale. Click the buttons below each graph to switch source data.
 |
|||||||||
| Corsair Force LS 240GB | Corsair Neutron 240GB | Samsung SSD 840 EVO 250GB | Kingston SSDNow V300 240GB | Samsung SSD 840 Pro 256GB | |||||
| Default | |||||||||
| 25% OP | - | ||||||||
Performance consistency with the Force LS is okay for a budget drive. It's clearly nowhere near the Neutron but compared to Samsung SSD 840 EVO and Pro, it's not bad (though keep in mind that the Force LS has more over-provisioning by default). What's a bit of a letdown is the fact that increasing the over-provisioning doesn't really improve IO consistency. The time it takes to enter steady-state is longer but the actual steady-state performance is essentially unchanged.
 |
|||||||||
| Corsair Force LS 240GB | Corsair Neutron 240GB | Samsung SSD 840 EVO 250GB | Kingston SSDNow V300 240GB | Samsung SSD 840 Pro 256GB | |||||
| Default | |||||||||
| 25% OP | - | ||||||||
 |
|||||||||
| Corsair Force LS 240GB | Corsair Neutron 240GB | Samsung SSD 840 EVO 250GB | Kingston SSDNow V300 240GB | Samsung SSD 840 Pro 256GB | |||||
| Default | |||||||||
| 25% OP | - | ||||||||
TRIM Validation
Our performance consistency tests take a deeper dive into the worst-case performance than our old TRIM/garbage collection tests did but the HD Tach method is still handy for checking TRIM functionality. Like before, I filled the drive with sequential data and then tortured with 4KB random writes (QD=32, 100% LBA) for 30 minutes:
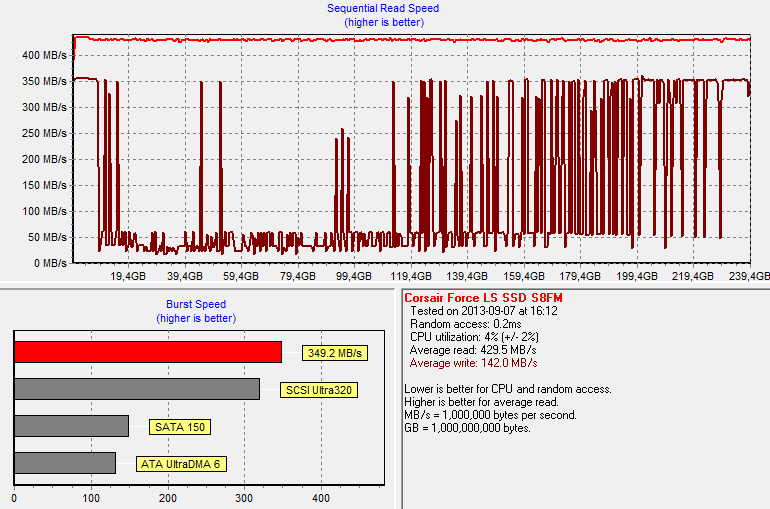
Worst-case performance is pretty low as we saw in the IO consistency tests. However, Phison's garbage collection is rather aggressive as during a single HD Tach pass the performance increases from ~30MB/s to a peak of 350MB/s.

A single TRIM pass recovers performance back to the original ~360MB/s.


25 Comments
View All Comments
LtGoonRush - Wednesday, September 25, 2013 - link
Crucial has had a pretty poor record with firmware issues, particularly on the M4. Even given the lower endurance of TLC NAND I think it is a reasonable to expect the Samsung 840 Evo to be a more reliable drive for most users.Bob Todd - Wednesday, September 25, 2013 - link
Other than the admittedly awful SMART Power On Hours bug that was fixed a long time ago, I think you need to back up that statement. Crucial has been one of the go-to SSD makers for a lot of people specifically for the reliability (along with Intel/Samsung).1Angelreloaded - Tuesday, October 1, 2013 - link
As long as it lasts 3-5 years, Who cares? by then you should be migrating to newer ones anyways and recycle it as a cache drive.JDG1980 - Wednesday, September 25, 2013 - link
I'd be concerned about reliability with a new, unproven controller - especially when it comes from a company I've never heard of before.It sounds like Marvell controllers are inexpensive, but the cost of each company writing its own firmware drives prices up. I'd like to see a Marvell-based SSD with open-source firmware.
SteelCity1981 - Wednesday, September 25, 2013 - link
I would have liked to have seen the Samsung 840 250gb EVO in rapid mode in this benchmark to see the extra performance increase.red12355 - Wednesday, September 25, 2013 - link
Sort of unrelated, but is there ever going to be an Intel 530 SSD review? It got released a while back but hardly has any reviews.I remember there was a 520 review before the SSD was even out.
Kristian Vättö - Wednesday, September 25, 2013 - link
Intel has not approached us about the SSD 530 yet. Let me check with them to see if we can get a review sample.romrunning - Wednesday, September 25, 2013 - link
The colors on these graphs are very hard to distinguish, especially when you hit over-laying "pastel" type of colors. Is it too difficult to get colors that are easier to distinguish?Kristian Vättö - Wednesday, September 25, 2013 - link
What kind of colors would work the best in your opinion? We are always open to suggestions in order to make our content more user-friendly :)bobbozzo - Thursday, September 26, 2013 - link
RGB + CMYK might work out.Yellow on white is usually hard to see though.
Also, you'd need one more color as there are 8 drives tested.
I wonder what Tufte would say...