Samsung SSD 840 EVO Review: 120GB, 250GB, 500GB, 750GB & 1TB Models Tested
by Anand Lal Shimpi on July 25, 2013 1:53 PM EST- Posted in
- Storage
- SSDs
- Samsung
- TLC
- Samsung SSD 840
AnandTech Storage Bench 2011
Two years ago we introduced our AnandTech Storage Bench, a suite of benchmarks that took traces of real OS/application usage and played them back in a repeatable manner. I assembled the traces myself out of frustration with the majority of what we have today in terms of SSD benchmarks.
Although the AnandTech Storage Bench tests did a good job of characterizing SSD performance, they weren't stressful enough. All of the tests performed less than 10GB of reads/writes and typically involved only 4GB of writes specifically. That's not even enough exceed the spare area on most SSDs. Most canned SSD benchmarks don't even come close to writing a single gigabyte of data, but that doesn't mean that simply writing 4GB is acceptable.
Originally I kept the benchmarks short enough that they wouldn't be a burden to run (~30 minutes) but long enough that they were representative of what a power user might do with their system.
Not too long ago I tweeted that I had created what I referred to as the Mother of All SSD Benchmarks (MOASB). Rather than only writing 4GB of data to the drive, this benchmark writes 106.32GB. It's the load you'd put on a drive after nearly two weeks of constant usage. And it takes a *long* time to run.
1) The MOASB, officially called AnandTech Storage Bench 2011 - Heavy Workload, mainly focuses on the times when your I/O activity is the highest. There is a lot of downloading and application installing that happens during the course of this test. My thinking was that it's during application installs, file copies, downloading and multitasking with all of this that you can really notice performance differences between drives.
2) I tried to cover as many bases as possible with the software I incorporated into this test. There's a lot of photo editing in Photoshop, HTML editing in Dreamweaver, web browsing, game playing/level loading (Starcraft II & WoW are both a part of the test) as well as general use stuff (application installing, virus scanning). I included a large amount of email downloading, document creation and editing as well. To top it all off I even use Visual Studio 2008 to build Chromium during the test.
The test has 2,168,893 read operations and 1,783,447 write operations. The IO breakdown is as follows:
| AnandTech Storage Bench 2011 - Heavy Workload IO Breakdown | ||||
| IO Size | % of Total | |||
| 4KB | 28% | |||
| 16KB | 10% | |||
| 32KB | 10% | |||
| 64KB | 4% | |||
Only 42% of all operations are sequential, the rest range from pseudo to fully random (with most falling in the pseudo-random category). Average queue depth is 4.625 IOs, with 59% of operations taking place in an IO queue of 1.
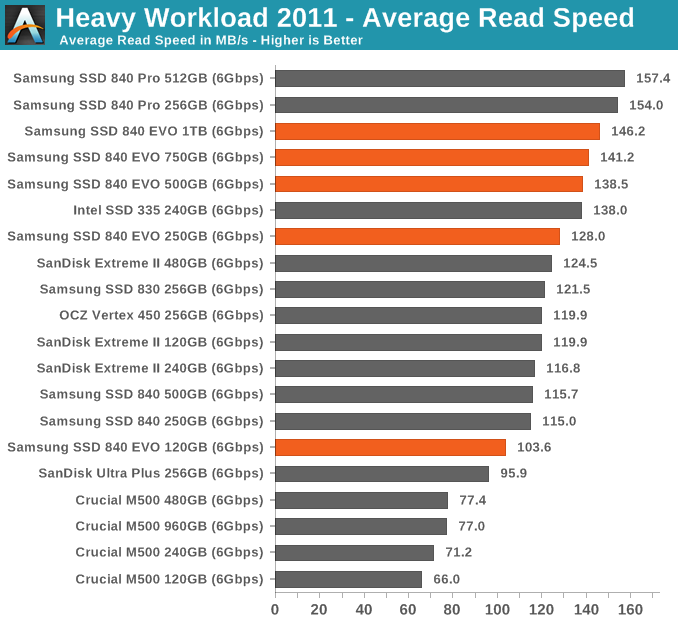
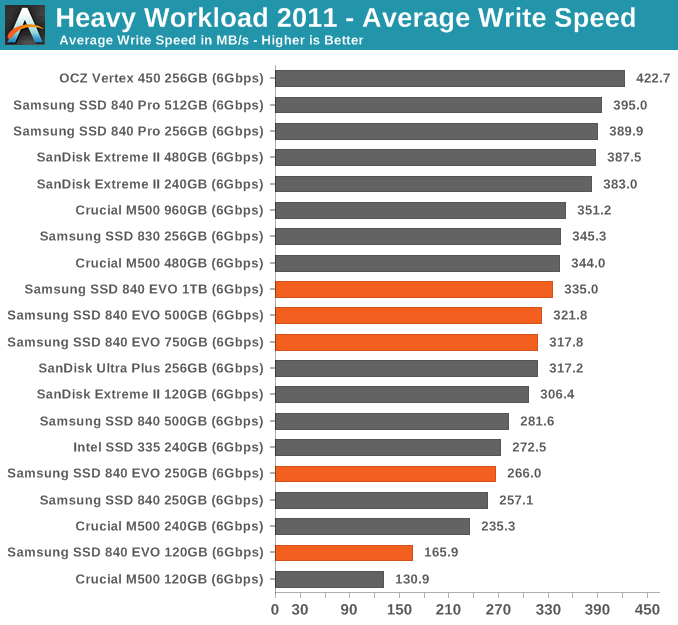
Many of you have asked for a better way to really characterize performance. Simply looking at IOPS doesn't really say much. As a result I'm going to be presenting Storage Bench 2011 data in a slightly different way. We'll have performance represented as Average MB/s, with higher numbers being better. At the same time I'll be reporting how long the SSD was busy while running this test. These disk busy graphs will show you exactly how much time was shaved off by using a faster drive vs. a slower one during the course of this test. Finally, I will also break out performance into reads, writes and combined. The reason I do this is to help balance out the fact that this test is unusually write intensive, which can often hide the benefits of a drive with good read performance.
There's also a new light workload for 2011. This is a far more reasonable, typical every day use case benchmark. Lots of web browsing, photo editing (but with a greater focus on photo consumption), video playback as well as some application installs and gaming. This test isn't nearly as write intensive as the MOASB but it's still multiple times more write intensive than what we were running in 2010.
As always I don't believe that these two benchmarks alone are enough to characterize the performance of a drive, but hopefully along with the rest of our tests they will help provide a better idea.
The testbed for Storage Bench 2011 has changed as well. We're now using a Sandy Bridge platform with full 6Gbps support for these tests.
AnandTech Storage Bench 2011 - Heavy Workload
We'll start out by looking at average data rate throughout our new heavy workload test:
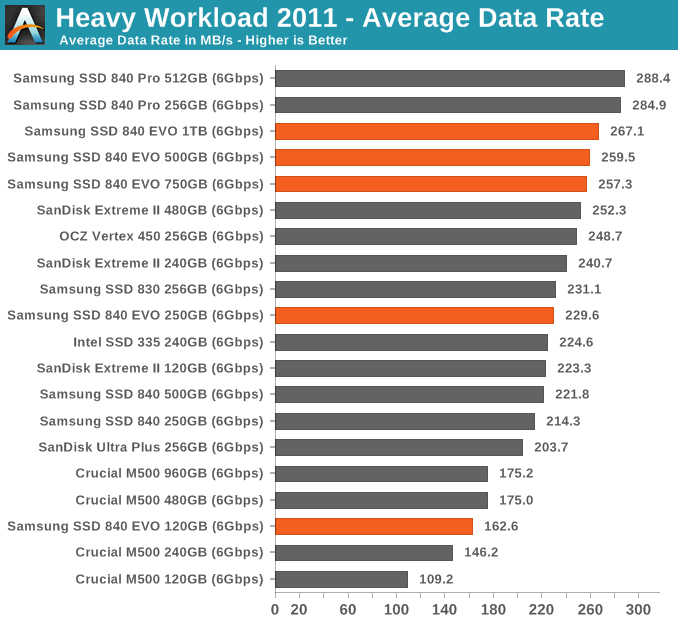
In lighter workloads than our 2013 workload the EVO still does incredibly well.
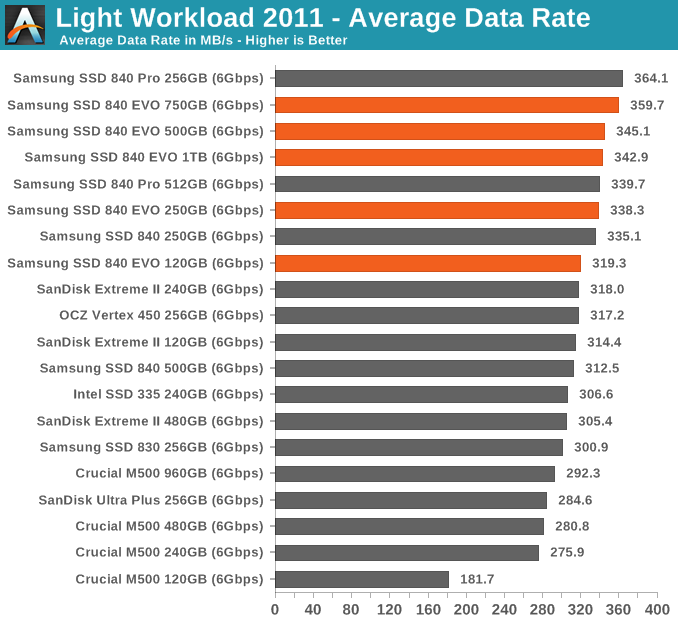
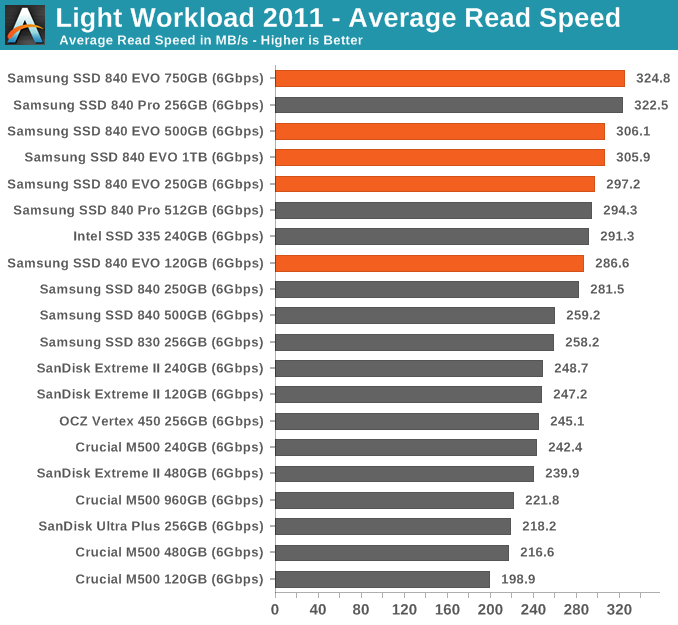
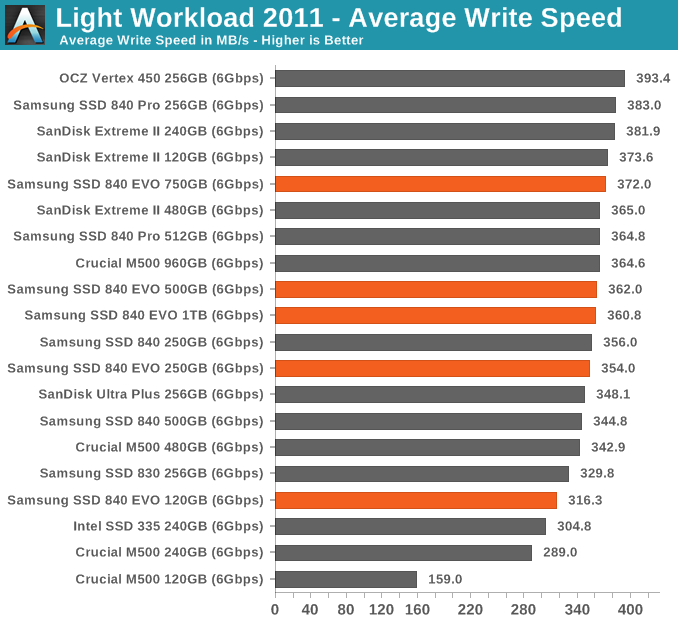
AnandTech Storage Bench 2011 - Light Workload
Our new light workload actually has more write operations than read operations. The split is as follows: 372,630 reads and 459,709 writes. The relatively close read/write ratio does better mimic a typical light workload (although even lighter workloads would be far more read centric).
The I/O breakdown is similar to the heavy workload at small IOs, however you'll notice that there are far fewer large IO transfers:
| AnandTech Storage Bench 2011 - Light Workload IO Breakdown | ||||
| IO Size | % of Total | |||
| 4KB | 27% | |||
| 16KB | 8% | |||
| 32KB | 6% | |||
| 64KB | 5% | |||


137 Comments
View All Comments
Riven98 - Thursday, July 25, 2013 - link
Anand,Thanks for the great article. I had just been thinking that there had been a downturn in the number of articles like these, which are the main reasons I visit on an almost daily basis.
chrnochime - Friday, July 26, 2013 - link
Still recommending a technology that's known to not last as long as the MLC. Yes the *extropolated* result indicates that its lifetime is far longer than advertised, but really, why when even M500 is not that slow in the first place and cost about the same, why risk going with the TLC? Not to mention Samsung's 830 has its fair share of horror stories as well...watersb - Friday, July 26, 2013 - link
Excellent review.How does write amplification scale as the disk fills up? Wouldn't a full disk fail more rapidly than a half-full one?
BobAjob2000 - Tuesday, January 28, 2014 - link
Hopefully wear leveling and TRIM/garbage collection algorithms should take care of your concerns. They should take existing unchanged 'cold' data and move it around to make way for regularly changed 'hot' data. This should reduce the impact of both data longevity and write amplification as it guides new writes to hit the 'freshest' unused or rarely written blocks on the disk and also helps to ensure that data goes not go 'stale' after being untouched for years. Different vendors use different algorithms that have evolved and improved over time. I think Samsung (being a RAM manufacturer) can possibly provide better RAM caches for their disks that may provide advantages for garbage collection and wear leveling algorithms by improving the available 'thinking space' for the caching and sorting/organizing of 'hot' data.Its all to do with managing the 'temperature' of your data somewhat like a data 'weather forecast' which can be very useful in the short term or for simple predictable/settled patterns but less practical for long term or unseasonal data storms.
Would like to see these things tested by 'what if' scenarios though to demonstrate the differences between different vendors algorithms.
xtreme2k - Friday, July 26, 2013 - link
Can anyone tell me why I am paying 90% of the price for 33% of the endurance of a drive?MrSpadge - Saturday, July 27, 2013 - link
Because endurance doesn't matter (very likely also for you), but price does.log - Friday, July 26, 2013 - link
Can you partition this drive and still take advantage of its features? ThnaksTimur Born - Friday, July 26, 2013 - link
I don't quite understand exactly why the Samsung RAPID software cache brings higher performance in *practice* than Windows' own cache? Using two software caches will lead to the same information being stored in RAM twice or even thrice, which is exactly what the Windows cache tries to avoid since XP days.That the usual benchmark programs get fooled is visible, as they think to be working without a software cache. So the higher values there are not surprising. But I am a bit puzzled why the Anand Storage Bench results increase, too?! Why is RAPID software caching better than Windows' own cache in this scenario? Or does the ASB bypass Windows' cache, too (like most benchmarks)?
By the way: ATTO allows the Windows cache to be turned ON for testing. My "old" Crucial M4 256 gets sees very high read results once ATTO makes use of Windows' cache. Only the write rates remain significantly smaller.
Therefor an ATTO test with combinations of either or both software caches (RAPID and Windows) would be interesting.
MrSpadge - Saturday, July 27, 2013 - link
I think it's because Samsung is being much more agressive with caching than Win dares to be, i.e. it holds files far longer before writing them, so they can be combined more efficiently but are longer at risk of being lost.Timur Born - Sunday, July 28, 2013 - link
I am not convinced about that yet, especially since you can turn off drive cache flushing via Device-Manager and thus should get an even more aggressive Windows cache behavior than what RAPID offers (which is reported to adhere to Windows' flush commands).The Windows cache is designed to keep data in RAM for as long as it's not needed for something else. Even more important, data is *directly* executed from inside the Windows cache instead of being copied back and forth between separate memory regions. This keeps duplication to a minimum (implemented since XP as far as I remember). So at least for reads the Windows cache is very useful, especially in combination with Superfetch, which is *not* disabled for SSDs btw (even Prefetch for the boot phase isn't disabled, but in practice it makes not much of a difference whether you boot with or without Prefetch from an SSD).
There is something funky going on with Windows' cache and the drive's onboard cache of my Crucial M4 in combination with ATTO (Windows cache enabled). Different block sizes get very different results, with some *larger* block sizes not benefiting from Windows' cache either at read or write, the latter depending on the block size chosen. Turning the drive's own cache flushing on/off via Device-Manager can have an impact on that, too.
In some cases I get less throughput with Windows cache than without (i.e. 512 kb block size with drive flushing on). This may be an issue of ATTO, though, because I also got some measurements where ATTO claimed a write speed of zero (0)! Turning off either drive cache flushing or the Windows cache or both helps ATTO to get meaningful measurements again.
So the main question remains: How and why would RAPID affect "real-world" performance on top of the Windows cache and does the Anand Storage Bench deliberately circumvent the Windows cache?
The reason I was looking at this review was that I am currently looking for a new SSD to build a desktop PC and the 840 EVO looks like the thing to buy. So once I get my hands on one myself I will just try RAPID myself. ;)