SanDisk Extreme II Review (480GB, 240GB, 120GB)
by Anand Lal Shimpi on June 3, 2013 7:19 PM ESTPerformance Consistency
In our Intel SSD DC S3700 review I introduced a new method of characterizing performance: looking at the latency of individual operations over time. The S3700 promised a level of performance consistency that was unmatched in the industry, and as a result needed some additional testing to show that. The reason we don't have consistent IO latency with SSDs is because inevitably all controllers have to do some amount of defragmentation or garbage collection in order to continue operating at high speeds. When and how an SSD decides to run its defrag and cleanup routines directly impacts the user experience. Frequent (borderline aggressive) cleanup generally results in more stable performance, while delaying that can result in higher peak performance at the expense of much lower worst case performance. The graphs below tell us a lot about the architecture of these SSDs and how they handle internal defragmentation.
To generate the data below I took a freshly secure erased SSD and filled it with sequential data. This ensures that all user accessible LBAs have data associated with them. Next I kicked off a 4KB random write workload across all LBAs at a queue depth of 32 using incompressible data. I ran the test for just over half an hour, no where near what we run our steady state tests for but enough to give me a good look at drive behavior once all spare area filled up.
I recorded instantaneous IOPS every second for the duration of the test. I then plotted IOPS vs. time and generated the scatter plots below. Each set of graphs features the same scale. The first two sets use a log scale for easy comparison, while the last set of graphs uses a linear scale that tops out at 50K IOPS for better visualization of differences between drives.
The high level testing methodology remains unchanged from our S3700 review. Unlike in previous reviews however, I did vary the percentage of the drive that I filled/tested depending on the amount of spare area I was trying to simulate. The buttons are labeled with the advertised user capacity had the SSD vendor decided to use that specific amount of spare area. If you want to replicate this on your own all you need to do is create a partition smaller than the total capacity of the drive and leave the remaining space unused to simulate a larger amount of spare area. The partitioning step isn't absolutely necessary in every case but it's an easy way to make sure you never exceed your allocated spare area. It's a good idea to do this from the start (e.g. secure erase, partition, then install Windows), but if you are working backwards you can always create the spare area partition, format it to TRIM it, then delete the partition. Finally, this method of creating spare area works on the drives we've tested here but not all controllers may behave the same way.
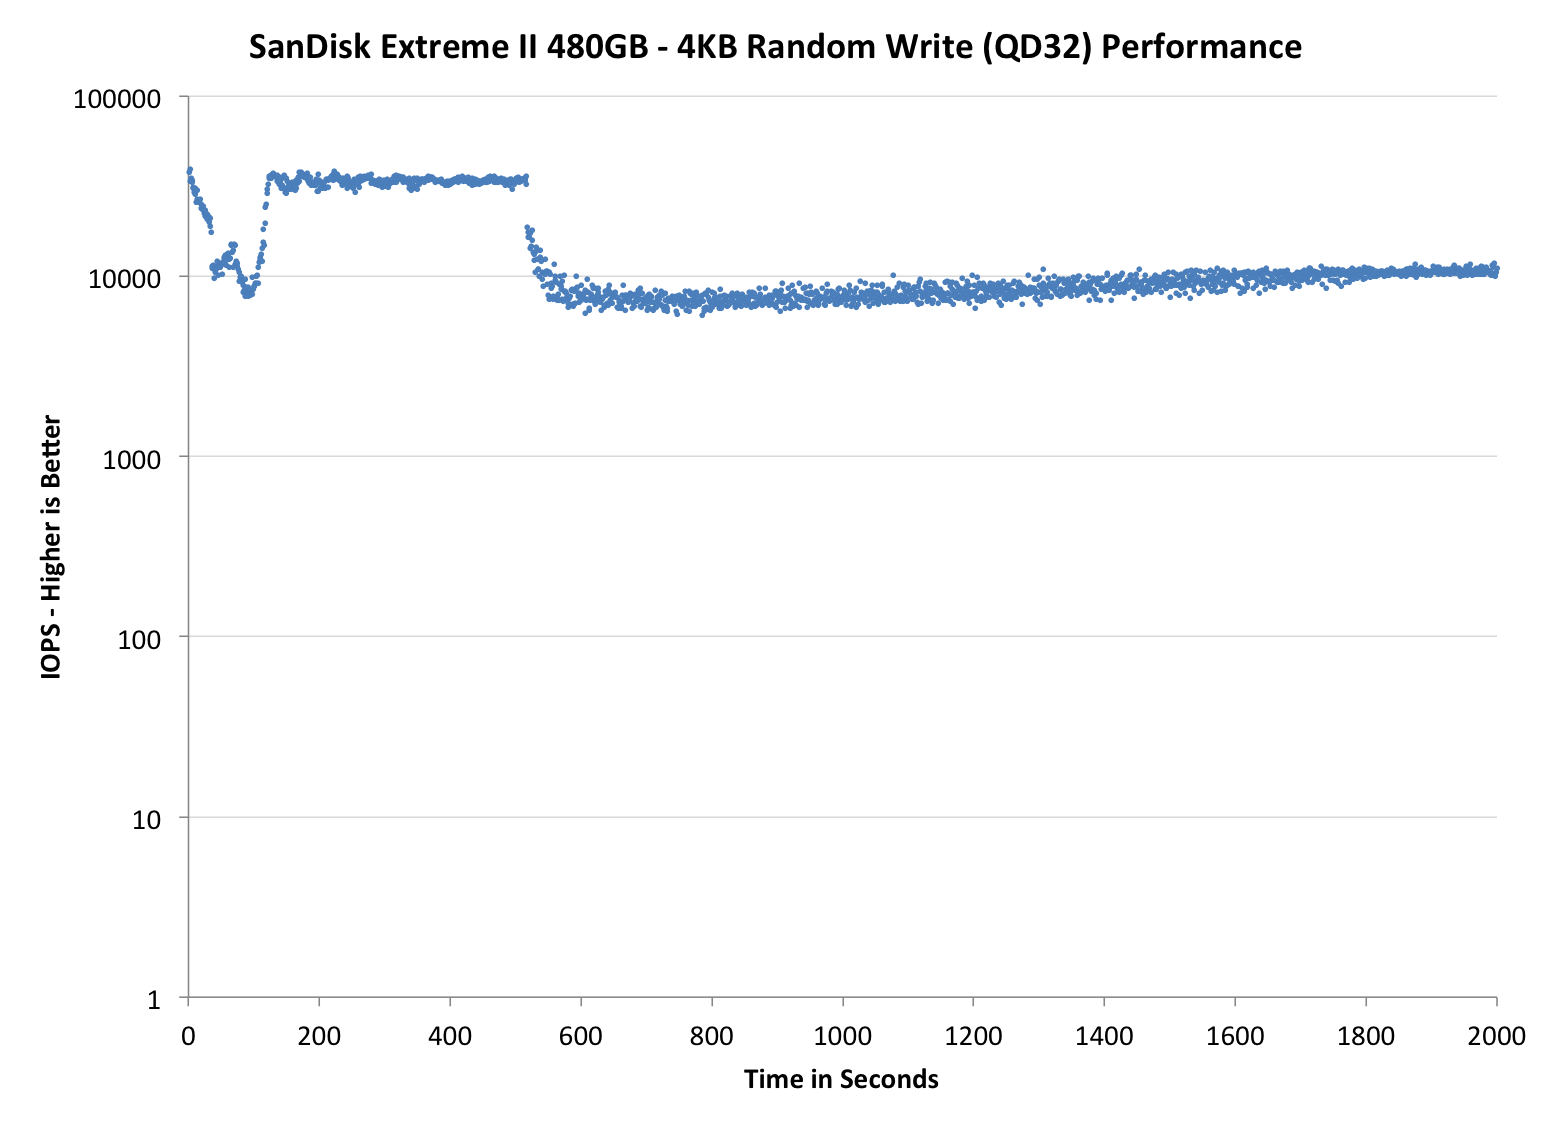
The first set of graphs shows the performance data over the entire 2000 second test period. In these charts you'll notice an early period of very high performance followed by a sharp dropoff. What you're seeing in that case is the drive allocating new blocks from its spare area, then eventually using up all free blocks and having to perform a read-modify-write for all subsequent writes (write amplification goes up, performance goes down).
The second set of graphs zooms in to the beginning of steady state operation for the drive (t=1400s). The third set also looks at the beginning of steady state operation but on a linear performance scale. Click the buttons below each graph to switch source data.
 |
|||||||||
| Corsair Neutron 240GB | Crucial M500 960GB | Samsung SSD 840 Pro 256GB | SanDisk Extreme II 480GB | Seagate 600 480GB | |||||
| Default | |||||||||
| 25% Spare Area | |||||||||
Um, hello, awesome? The SanDisk Extreme II is the first Marvell based consumer SSD to actually prioritize performance consistency. The Extreme II does significantly better than pretty much every other drive here with the exception of Corsair's Neutron. Note that increasing the amount of spare area on the drive actually reduces IO consistency, at least during the short duration of this test, as SanDisk's firmware aggressively attempts to improve the overall performance of the drive. Either way this is the first SSD from a big OEM supplier that actually delivers consistent performance in the worst case scenario.
 |
|||||||||
| Corsair Neutron 240GB | Crucial M500 960GB | Samsung SSD 840 Pro 256GB | SanDisk Extreme II 480GB | Seagate 600 480GB | |||||
| Default | |||||||||
| 25% Spare Area | |||||||||
 |
|||||||||
| Corsair Neutron 240GB | Crucial M500 960GB | Samsung SSD 840 Pro 256GB | SanDisk Extreme II 480GB | Seagate 600 480GB | |||||
| Default | |||||||||
| 25% Spare Area | |||||||||


51 Comments
View All Comments
HardwareDufus - Monday, June 3, 2013 - link
Amazing. I am using an OCZ Vertex4 256GB drive. Bought it last Nov for about $224. Very happy with it.This SanDisk drive is the same price ($229), same capacity (240GB), same format. However, it is performing a full 5% to almost 100% better, depending on block size, random/sequential, read/write activity. Amazing what 7 to 12 months has brought to the SSD market!
Vincent - Monday, June 3, 2013 - link
You wrote: "In our Intel SSD DC S3700 review I introduced a new method of characterizing performance: looking at the latency of individual operations over time"In fact this is not what your test does. Your test records IOPS in one-second periods, but does not measure the latency of individual IOs. It would in fact be interesting to see the latency distribution for these drives.
Tjalve - Tuesday, June 4, 2013 - link
Ive done som IO Latency tests based on my own trace-based benchmark if your interested.http://www.nordichardware.se/SSD-Recensioner/svens...
http://www.nordichardware.se/SSD-Recensioner/svens...
http://www.nordichardware.se/SSD-Recensioner/svens...
The text is in swedish, but you should be able to understand the graphs. I could make aplot diagram of individual IOs Latency if anyone is interested,
kallogan - Tuesday, June 4, 2013 - link
I still have an indilinx 64GB.dishayu - Tuesday, June 4, 2013 - link
Is it just me or have the SSD prices stagnated since the past year or so? I bought a 120GB Plextor M5S for $85 in July 2012 and the 128 GB SSDs still seem to hover in the 100-120$ range.sna1970 - Tuesday, June 4, 2013 - link
Hey Anand , can you please test 6 SSD Raid 0 with the new Haswell Z87 motherboards ?we need to make sure we can hit 3G/s , what is the maximum bandwidth of the new chipset ?
cbk - Tuesday, June 4, 2013 - link
This looks awesome, it's almost neck-to-neck to the 840 Pro, at a lower price.jeffrey - Tuesday, June 4, 2013 - link
Hi Anand,Do you plan on covering the OCZ Vertex 450?
jeffrey - Tuesday, June 4, 2013 - link
Press Release:http://ocz.com/consumer/company/newsroom/press/ocz...
Kristian Vättö - Tuesday, June 4, 2013 - link
All tests have been run but I guess Haswell and other Computex stuff got on the way.