SanDisk Extreme II Review (480GB, 240GB, 120GB)
by Anand Lal Shimpi on June 3, 2013 7:19 PM ESTAnandTech Storage Bench 2011
Two years ago we introduced our AnandTech Storage Bench, a suite of benchmarks that took traces of real OS/application usage and played them back in a repeatable manner. I assembled the traces myself out of frustration with the majority of what we have today in terms of SSD benchmarks.
Although the AnandTech Storage Bench tests did a good job of characterizing SSD performance, they weren't stressful enough. All of the tests performed less than 10GB of reads/writes and typically involved only 4GB of writes specifically. That's not even enough exceed the spare area on most SSDs. Most canned SSD benchmarks don't even come close to writing a single gigabyte of data, but that doesn't mean that simply writing 4GB is acceptable.
Originally I kept the benchmarks short enough that they wouldn't be a burden to run (~30 minutes) but long enough that they were representative of what a power user might do with their system.
Not too long ago I tweeted that I had created what I referred to as the Mother of All SSD Benchmarks (MOASB). Rather than only writing 4GB of data to the drive, this benchmark writes 106.32GB. It's the load you'd put on a drive after nearly two weeks of constant usage. And it takes a *long* time to run.
1) The MOASB, officially called AnandTech Storage Bench 2011 - Heavy Workload, mainly focuses on the times when your I/O activity is the highest. There is a lot of downloading and application installing that happens during the course of this test. My thinking was that it's during application installs, file copies, downloading and multitasking with all of this that you can really notice performance differences between drives.
2) I tried to cover as many bases as possible with the software I incorporated into this test. There's a lot of photo editing in Photoshop, HTML editing in Dreamweaver, web browsing, game playing/level loading (Starcraft II & WoW are both a part of the test) as well as general use stuff (application installing, virus scanning). I included a large amount of email downloading, document creation and editing as well. To top it all off I even use Visual Studio 2008 to build Chromium during the test.
The test has 2,168,893 read operations and 1,783,447 write operations. The IO breakdown is as follows:
| AnandTech Storage Bench 2011 - Heavy Workload IO Breakdown | ||||
| IO Size | % of Total | |||
| 4KB | 28% | |||
| 16KB | 10% | |||
| 32KB | 10% | |||
| 64KB | 4% | |||
Only 42% of all operations are sequential, the rest range from pseudo to fully random (with most falling in the pseudo-random category). Average queue depth is 4.625 IOs, with 59% of operations taking place in an IO queue of 1.
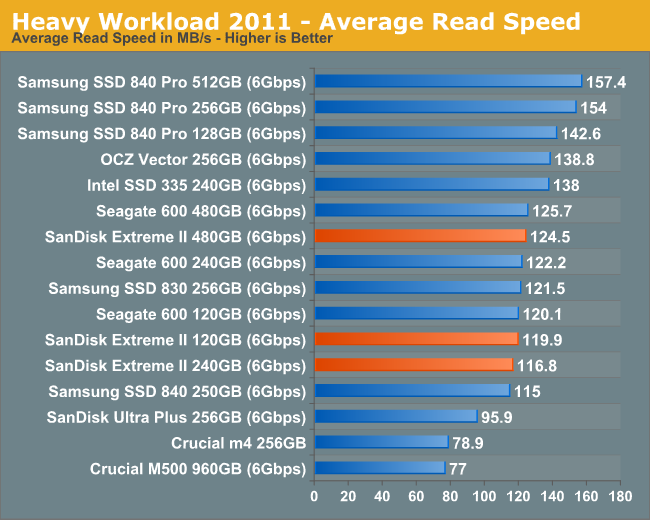
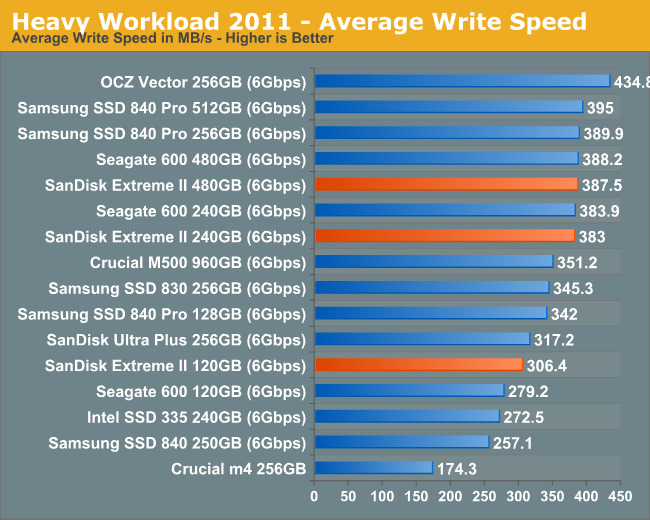
Many of you have asked for a better way to really characterize performance. Simply looking at IOPS doesn't really say much. As a result I'm going to be presenting Storage Bench 2011 data in a slightly different way. We'll have performance represented as Average MB/s, with higher numbers being better. At the same time I'll be reporting how long the SSD was busy while running this test. These disk busy graphs will show you exactly how much time was shaved off by using a faster drive vs. a slower one during the course of this test. Finally, I will also break out performance into reads, writes and combined. The reason I do this is to help balance out the fact that this test is unusually write intensive, which can often hide the benefits of a drive with good read performance.
There's also a new light workload for 2011. This is a far more reasonable, typical every day use case benchmark. Lots of web browsing, photo editing (but with a greater focus on photo consumption), video playback as well as some application installs and gaming. This test isn't nearly as write intensive as the MOASB but it's still multiple times more write intensive than what we were running in 2010.
As always I don't believe that these two benchmarks alone are enough to characterize the performance of a drive, but hopefully along with the rest of our tests they will help provide a better idea.
The testbed for Storage Bench 2011 has changed as well. We're now using a Sandy Bridge platform with full 6Gbps support for these tests.
AnandTech Storage Bench 2011 - Heavy Workload
We'll start out by looking at average data rate throughout our new heavy workload test:
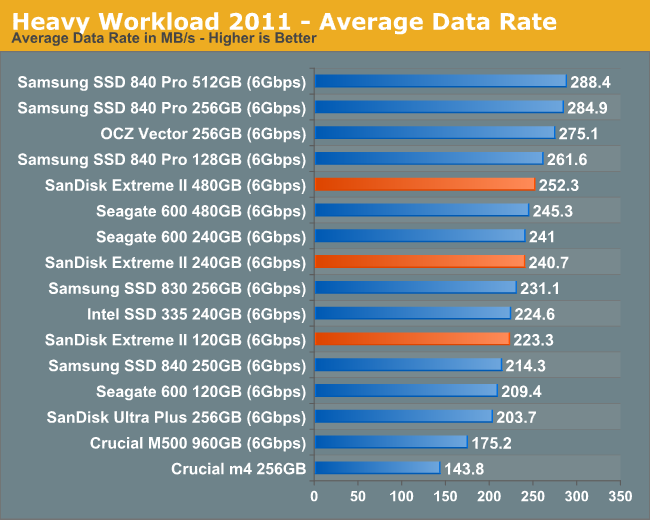
The Extreme II's peak performance isn't as good as the 840 Pro or OCZ Vector, but it's definitely very quick.
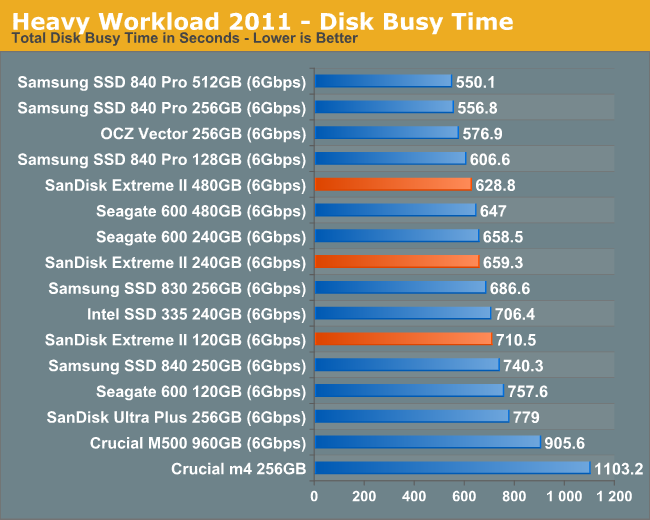
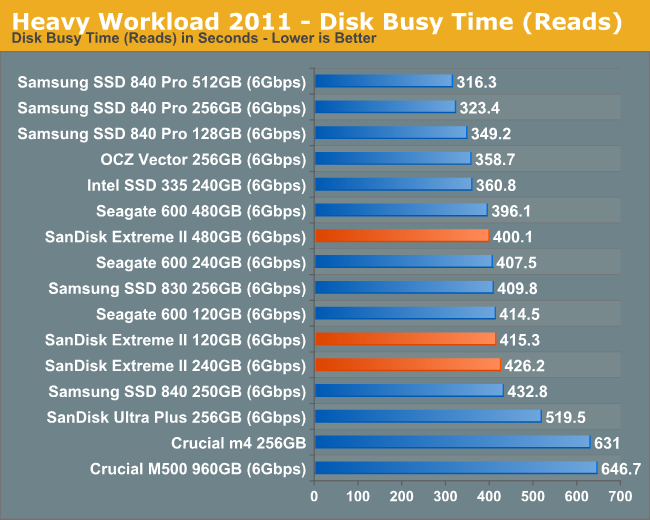
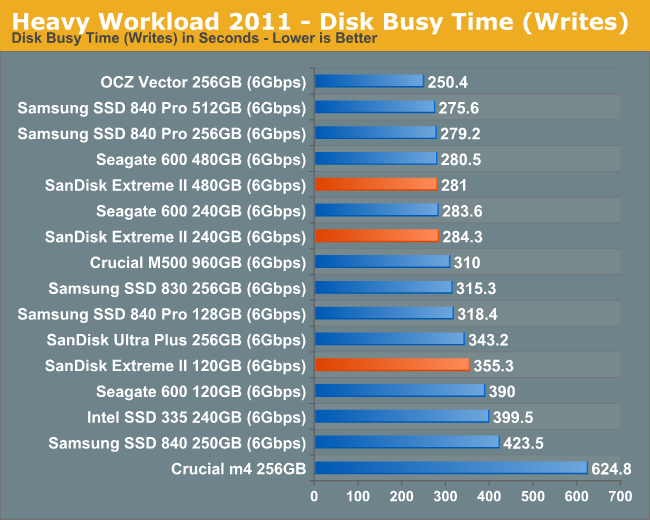
The next three charts just represent the same data, but in a different manner. Instead of looking at average data rate, we're looking at how long the disk was busy for during this entire test. Note that disk busy time excludes any and all idles, this is just how long the SSD was busy doing something:


51 Comments
View All Comments
jhh - Monday, June 3, 2013 - link
I wish there were more latency measurements. The only latency measurements were during the Destroyer benchmark. Latency under a lower load would be a useful metric. We are using NFS on top of ZFS, and latency is the biggest driver of performance.jmke - Tuesday, June 4, 2013 - link
there is still a lot of headroom left; storage is still the bottleneck of any computer; even with 24 SSDs in RAID 0 you still don't get lightening speed.Try a RAM drive which allows for 7700Mb/s write speed and 1000+mb/s at 4k random write
http://www.madshrimps.be/vbulletin/f22/12-software...
put some data on there, and you can now start stressing your CPU again :)
iwod - Tuesday, June 4, 2013 - link
The biggest bottleneck is Software. And even with my SSD running in SATA 2, my Core2Duo running Windows 8 can boot just 10 seconds. And Windows 7 within 15 seconds. With my Ivy Bridge +SATA 3 SSD running 1 - 2 seconds faster on boot time.In terms of consumer usage, 99% of us will properly need much faster Seq Read Write Speed. We are near the end of Random Write improvement. Where Random Read we could do with a lot more increase.
Once we move to SATA Express with 16Gbps, we could be moving the bottleneck back to CPU. And Since we are not going to get much more IPC and Ghz improvements, we are going to need software written with Multi Core in mind to see further improvement gains. So quite possible the next generation of Chipset and CPU will be the last of this generation before we have software move to Multi Core paradigm. Which, looking at it now is going to take a long time.
glugglug - Tuesday, June 4, 2013 - link
Outside of enterprise server workloads, I don't think you will notice a difference between current SSDs.However, higher random write IOPS is an indicator of lower write amplification, so it could be a useful signal to guess at how long before the drive wears out.
vinuneuro - Tuesday, December 3, 2013 - link
For most users, a long time ago it stopped mattering. In a machine used for Word/Excel/Powerpoint, Internet, Email, Movies, I stopped being able to perceive a difference day to day after the Intel X25-M/320. I tried Samsung 470's and 830's and got rid of both for cheaper Intel 320's.whyso - Monday, June 3, 2013 - link
Honestly for the average person and most enthusiasts SSDs are plenty fast and a difference isn't noticeable unless you are benchmarking (unless the drive is flat out horrible; bute the difference between a m400 and a 840 pro are unnoticible unless you are looking for it). The most important parts of an SSD then become performance consistency (though really few people actually apply a workload where that is a problem), power use (mainly for mobile), and RELIABILITY.TrackSmart - Monday, June 3, 2013 - link
I agree 100%. I can't tell the difference between the fast SSDs from the last generation and those of the current generation in day-to-day usage. The fact that Anand had to work so hard to create a testing environment that would show significant differences between modern SSDs is very telling. Given that reality, I choose drives that are likely to be highly reliable (Crucial, Intel, Samsung) over those that have better benchmark scores.jabber - Tuesday, June 4, 2013 - link
Indeed, considering the mech HDDs the average user out there is using is lucky to push more than 50MBps with typical double figure access times.When they experience just 150MBps with single digit access times they nearly wet their pants.
MBps isn't the key for average use (as in folks that are not pushing gigabytes of data around all day) it's the access times.
SSD reviews for many are getting like graphics card reviews that go "Well this new card pushed the framerate from 205FPS to an amazing 235FPS!"
Erm great..I guess.
old-style - Monday, June 3, 2013 - link
Great review.I think Anand's penchant for on-drive encryption ignores an important aspect of firmware: it's software like everything else. Correctness trumps speed in encryption, and I would rather trust kernel hackers to encrypt my data than an OEM software team responsible for an SSD's closed-source firmware.
I'm not trying to malign OEM programmers, but encryption is notoriously difficult to get right, and I think it would be foolish to assume that an SSD's onboard encryption is as safe as the mature and widely used dm-crypt and Bitlocker implementations in Linux and Windows.
In my mind the lack of firmware encryption is a plus: the team at SanDisk either had the wisdom to avoid home-brewing an encryption routine from scratch, or they had more time to concentrate on the actual operation of the drive.
thestryker - Monday, June 3, 2013 - link
http://www.anandtech.com/show/6891/hardware-accele...I'm not sure you are aware of what he is referring to.