Intel Iris Pro 5200 Graphics Review: Core i7-4950HQ Tested
by Anand Lal Shimpi on June 1, 2013 10:01 AM ESTQuick Sync Performance
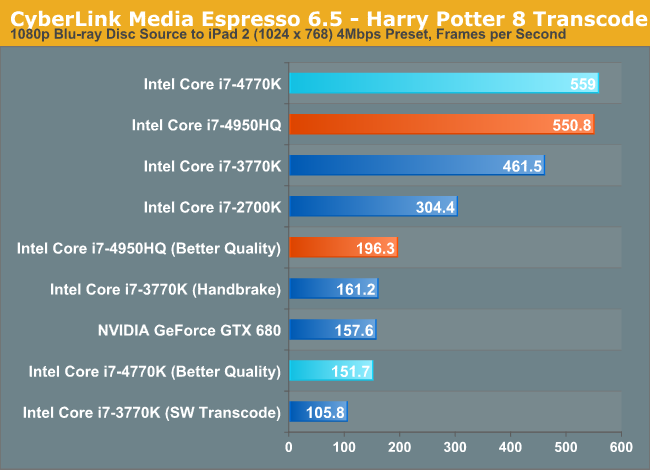
The 128MB eDRAM has a substantial impact on QuickSync performance. At a much lower TDP/clock speed, the i7-4950HQ is able to pretty much equal the performance of the i7-4770K. Running Haswell's new better quality transcode mode, the 4950HQ is actually 30% faster than the fastest desktop Haswell. This is just one of many reasons that we need Crystalwell on a K-series socketed desktop part.
CPU Performance
I spent most of the week wrestling with Iris Pro and gaming comparisons, but I did get a chance to run some comparison numbers between the i7-4950HQ CRB and the 15-inch MacBook Pro with Retina Display running Windows 8 in Boot Camp. In this case the 15-inch rMBP was running a 2.6GHz Core i7-3720QM with 3.6GHz max turbo. Other than the base clock (the i7-4950HQ features a 2.4GHz base clock), the two parts are very comparable as they have the same max turbo frequencies. I paid attention to turbo speeds while running all of the benchmarks and for the most part found the two systems were running at the same frequencies, for the same duration.
To put the results in perspective I threw in i7-3770K vs. i7-4770K results. The theory is that whatever gains the 4770K shows over the 3770K should be mirrored in the i7-4950HQ vs. i7-3720QM comparison. Any situations where the 4950HQ exceeds the 4770K's margin of victory over Ivy Bridge are likely due to the large 128MB L4 cache.
| Peak Theoretical GPU Performance | |||||||||||||||||||||
| Cinebench 11.5 (ST) | Cinebench 11.5 (MT) | POV-Ray 3.7RC7 (ST) | POV-Ray 3.7RC7 (MT) | 7-Zip Benchmark | 7-Zip Benchmark (Small) | x264 HD - 1st Pass | x264 HD - 2nd Pass | ||||||||||||||
| Intel Core i7-4770K | 1.78 | 8.07 | - | 1541.3 | 23101 | - | 79.1 | 16.5 | |||||||||||||
| Intel Core i7-3770K | 1.66 | 7.61 | - | 1363.6 | 22810 | - | 74.8 | 14.6 | |||||||||||||
| Haswell Advantage | 7.2% | 6.0% | - | 13.0% | 1.3% | - | 5.7% | 13.0% | |||||||||||||
| Intel Core i7-4950HQ | 1.61 | 7.38 | 271.7 | 1340.9 | 21022 | 14360 | 73.9 | 14.0 | |||||||||||||
| Intel Core i7-3720QM | 1.49 | 6.39 | 339.1 | 1178.3 | 19749 | 12670 | 66.2 | 12.9 | |||||||||||||
| Haswell Advantage | 8.1% | 15.5% | 24.8% | 13.8% | 6.4% | 13.3% | 11.6% | 8.5% | |||||||||||||
| Crystalwell Advantage | 0.9% | 9.5% | - | 0.8% | 5.1% | - | 5.9% | -4.5% | |||||||||||||
I didn't have a ton of time to go hunting for performance gains, but a couple of these numbers looked promising. Intel claims that with the right workload, you could see huge double digit gains. After I get back from Computex I plan on poking around a bit more to see if I can find exactly what those workloads might be.


177 Comments
View All Comments
kyuu - Saturday, June 1, 2013 - link
It's probably habit coming from eluding censoring.maba - Saturday, June 1, 2013 - link
To be fair, there is only one data point (GFXBenchmark 2.7 T-Rex HD - 4X MSAA) where the 47W cTDP configuration is more than 40% slower than the tested GT 650M (rMBP15 90W).Actually we have the following [min, max, avg, median] for 47W (55W):
games: 61%, 106%, 78%, 75% (62%, 112%, 82%, 76%)
synth.: 55%, 122%, 95%, 94% (59%, 131%, 102%, 100%)
compute: 85%, 514%, 205%, 153% (86%, 522%, 210%, 159%)
overall: 55%, 514%, 101%, 85% (59%, 522%, 106%, 92%)
So typically around 75% for games with a considerably lower TDP - not that bad.
I do not know whether Intel claimed equal or better performance given a specific TDP or not. With the given 47W (55W) compared to a 650M it would indeed be a false claim.
But my point is, that with at least ~60% performance and typically ~75% it is admittedly much closer than you stated.
whyso - Saturday, June 1, 2013 - link
Note your average 650m is clocked lower than the 650m reviewed here.lmcd - Saturday, June 1, 2013 - link
If I recall correctly, the rMBP 650m was clocked as high as or slightly higher than the 660m (which was really confusing at the time).JarredWalton - Sunday, June 2, 2013 - link
Correct. GT 650M by default is usually 835MHz + Boost, with 4GHz RAM. The GTX 660M is 875MHz + Boost with 4GHz RAM. So the rMBP15 is a best-case for GT 650M. However, it's not usually a ton faster than the regular GT 650M -- benchmarks for the UX51VZ are available here:http://www.anandtech.com/bench/Product/814
tipoo - Sunday, June 2, 2013 - link
I think any extra power just went to the rMBP scaling operations.DickGumshoe - Sunday, June 2, 2013 - link
Do you know if the scaling algorithms are handled by the CPU or the GPU on the rMBP?The big thing I am wondering is that if Apple releases a higher-end model with the MQ CPU's, would the HD 4600 be enough to eliminate the UI lag currently present on the rMBP's HD 4000?
If it's done on the GPU, then having the HQ CPU's might actually get *better* UI performance than the MQ CPU's for the rMPB.
lmcd - Sunday, June 2, 2013 - link
No, because these benchmarks would change the default resolution, which as I understand is something the panel would compensate for?Wait, aren't these typically done while the laptop screen is off and an external display is used?
whyso - Sunday, June 2, 2013 - link
You got this wrong. 650m is 735/1000 + boost to 850/1000. 660m is 835/1250 boost to 950/1250.jasonelmore - Sunday, June 2, 2013 - link
worst mistake intel made was that demo with DIRT when it was side by side with a 650m laptop. That set people's expectations. and it falls short in the reviews and people are dogging it. If they would have just kept quite people would be praising them up and down right now.